Core: Performance regression in 2.1 beta 2
I just tried to upgrade to 2.1 beta 2 where I didn't found any bugs but a regression in execution time when returning a lot of results. Memory also increases a lot.
As you can see when I get 9200 results (id, name):
In 2.0.10 it takes about 600ms

With 2.1.0 beta 2: 7s
I tried to downgrade, upgrade multiple times and I always have the same results. The regression seems to be linked to the serialisation part. Could you please check?
 raziel057
All 28 comments
Is it in dev / prod ?
is it at first run ?
 Simperfit
on 3 Aug 2017
Simperfit
on 3 Aug 2017
I have the same penalty in DEV and PROD env. Not only at first run, it's always the case.
raziel057
on 3 Aug 2017
@raziel057 Could you please try with current master ? Some cache improvement have been done in master.
Simperfit
on 3 Aug 2017
Did you try to run Blackfire on your project to localize the problem? It could help us to have a shared profile.
 meyerbaptiste
on 3 Aug 2017
meyerbaptiste
on 3 Aug 2017
@Simperfit I just tried to upgrade to dev-master:
Loading composer repositories with package information
Updating dependencies (including require-dev)
Package operations: 0 installs, 1 update, 0 removals
- Updating api-platform/core (v2.0.10 => dev-master 4fffea6): Checking out 4fffea6519
But I have the same (bad perf) results.
@meyerbaptiste I will create a Blackfire profile this afternoon.
raziel057
on 3 Aug 2017
Can you also check the Cache section?
 soyuka
on 3 Aug 2017
soyuka
on 3 Aug 2017
Each time I upgrade / downgrade I clean the cache and restart my server. Each time I have a perf issue in 2.1.0 and not in 2.0.10
raziel057
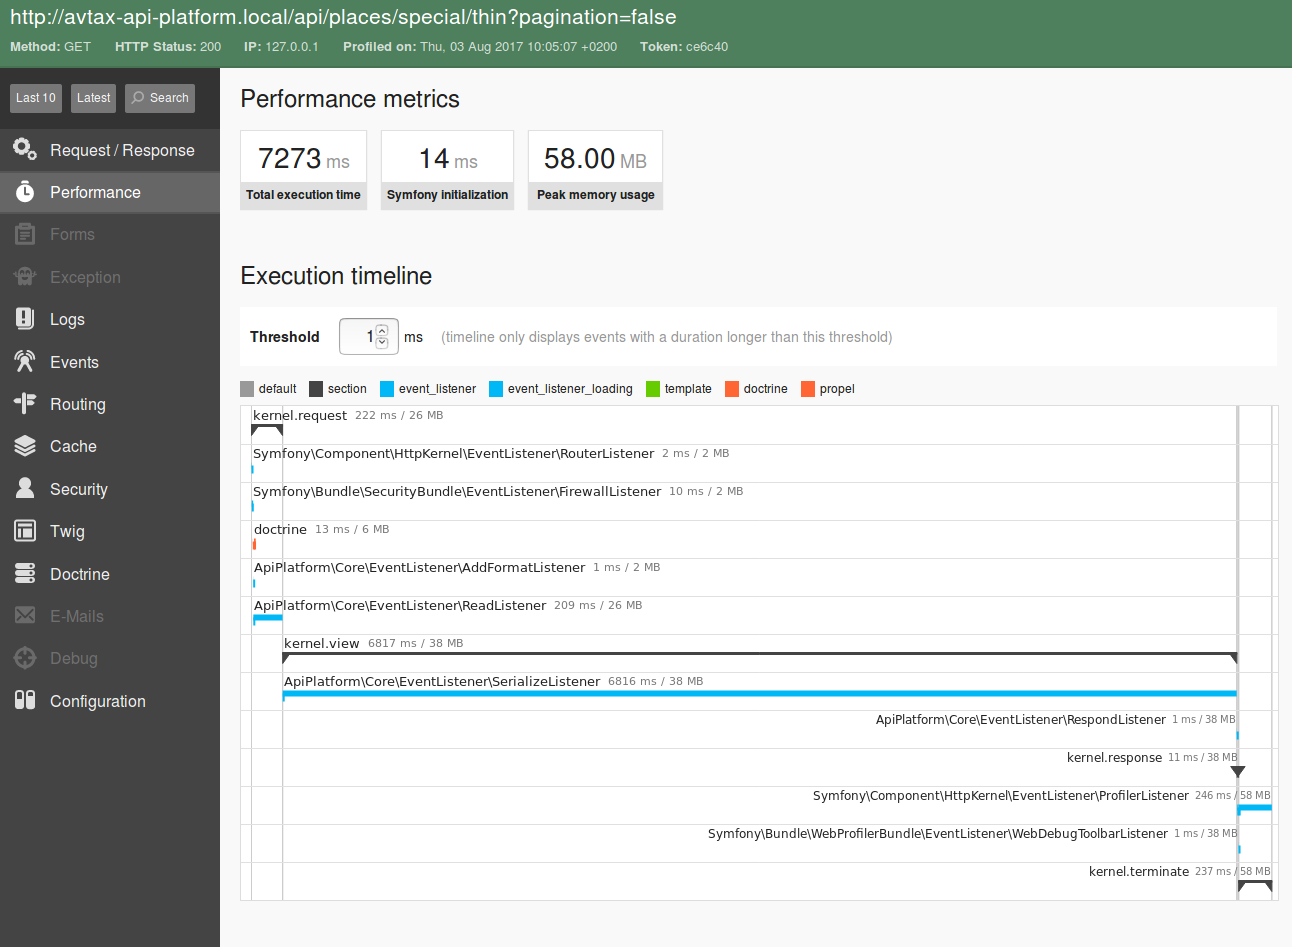
on 3 Aug 2017
Please find here the Blackfire profile:
https://blackfire.io/profiles/compare/5a87c426-1908-485d-aed4-7ae05d5f7c99/graph
2.0.10 (env DEV):
$ blackfire curl 'http://avtax-api-platform.local/api/places/special/thin?pagination=false' -H 'Host: avtax-api-platform.local' -H 'User-Agent: Mozilla/5.0 (X11; Ubuntu; Linux x86_64; rv:54.0) Gecko/20100101 Firefox/54.0' -H 'Accept: application/json' -H 'Accept-Language: en-US,en;q=0.7,fr;q=0.3' --compressed -H 'Referer: http://avtax-api-platform.local/api' -H 'Cookie: PHPSESSID=2hurci6ksscnlmfnobib83i5gm' -H 'Connection: keep-alive'
Profiling: [########################################] 10/10
Blackfire cURL completed
Graph URL https://blackfire.io/profiles/4554c77e-e8ac-41cc-8e40-9b317bc05213/graph
No tests! Create some now https://blackfire.io/docs/cookbooks/tests
No recommendations
Label | Value
--------------|---------------
Wall Time | 2.01s
I/O Wait | n/a
CPU Time | n/a
Memory | 65.2MB
Network | n/a n/a n/a
SQL | n/a n/a
2.1.0-dev (env DEV):
$ blackfire curl 'http://avtax-api-platform.local/api/places/special/thin?pagination=false' -H 'Host: avtax-api-platform.local' -H 'User-Agent: Mozilla/5.0 (X11; Ubuntu; Linux x86_64; rv:54.0) Gecko/20100101 Firefox/54.0' -H 'Accept: application/json' -H 'Accept-Language: en-US,en;q=0.7,fr;q=0.3' --compressed -H 'Referer: http://avtax-api-platform.local/api' -H 'Cookie: PHPSESSID=2hurci6ksscnlmfnobib83i5gm' -H 'Connection: keep-alive'
Profiling: [########################################] 10/10
Blackfire cURL completed
Graph URL https://blackfire.io/profiles/e234cd98-142f-4e95-8827-e1f7f64517a8/graph
No tests! Create some now https://blackfire.io/docs/cookbooks/tests
No recommendations
Label | Value
--------------|---------------
Wall Time | 8.99s
I/O Wait | n/a
CPU Time | n/a
Memory | 74.1MB
Network | n/a n/a n/a
SQL | n/a n/a
raziel057
on 3 Aug 2017
Looks like 2.1.0-dev is not using cache or I don't get it.
May you share both blackfire independently, diff doesn't say much :|.
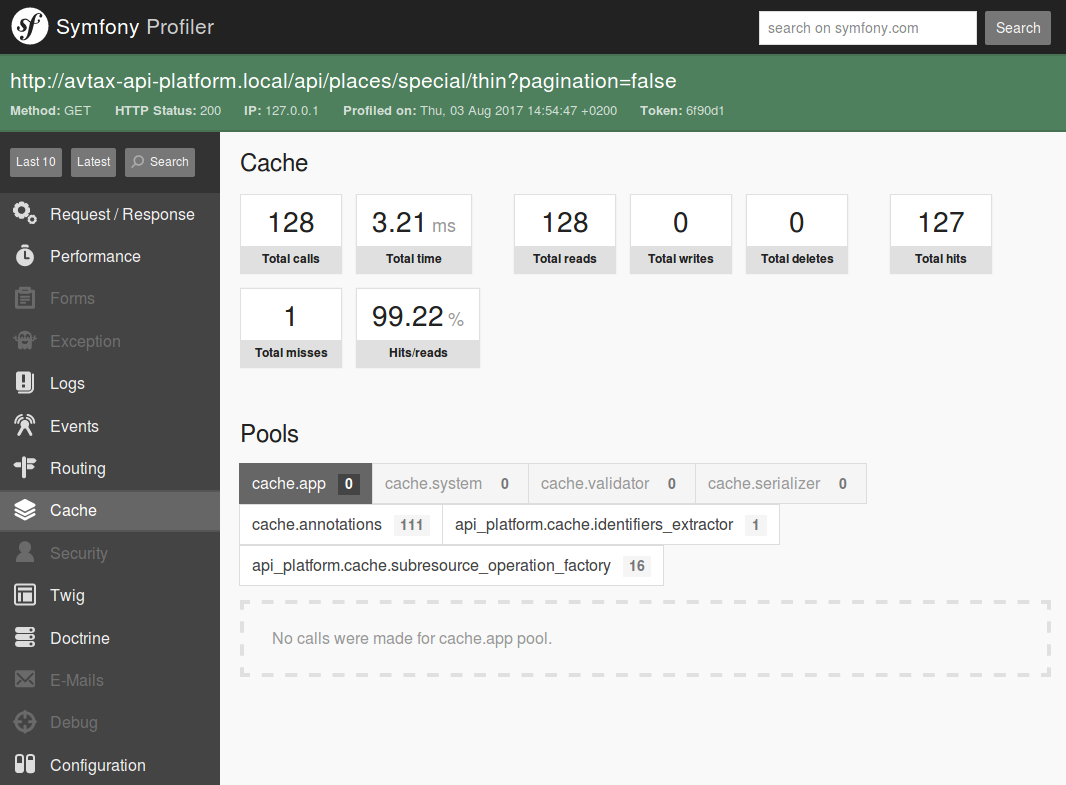
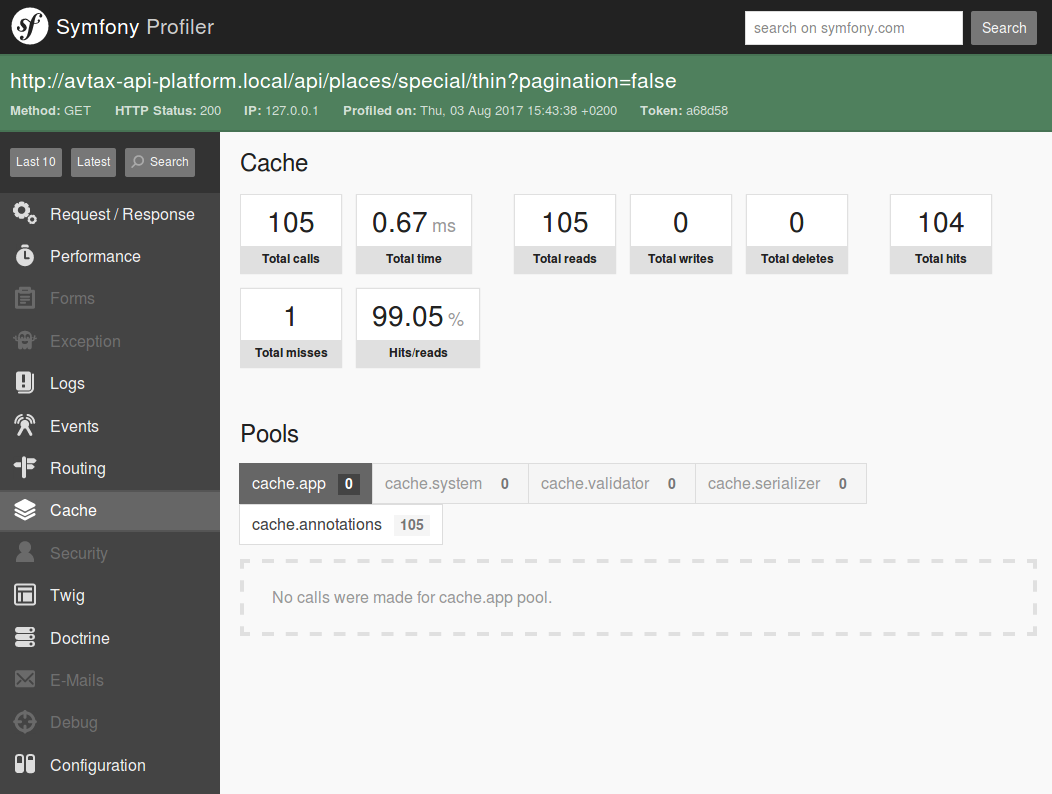
Also, in the symfony profiler, could you compare data from the Cache menu?
/edit: I tried to reproduce myself with no success, but still our data may be so much different and I have some hacks in place :|
soyuka
on 3 Aug 2017
Yes for sure:
2.0.10 : https://blackfire.io/profiles/4554c77e-e8ac-41cc-8e40-9b317bc05213/graph
2.1.0-dev : https://blackfire.io/profiles/e234cd98-142f-4e95-8827-e1f7f64517a8/graph
raziel057
on 3 Aug 2017
@soyuka is right IMO, It looks like the getCacheKey is triggering the cache to build instead of using it.
Simperfit
on 3 Aug 2017
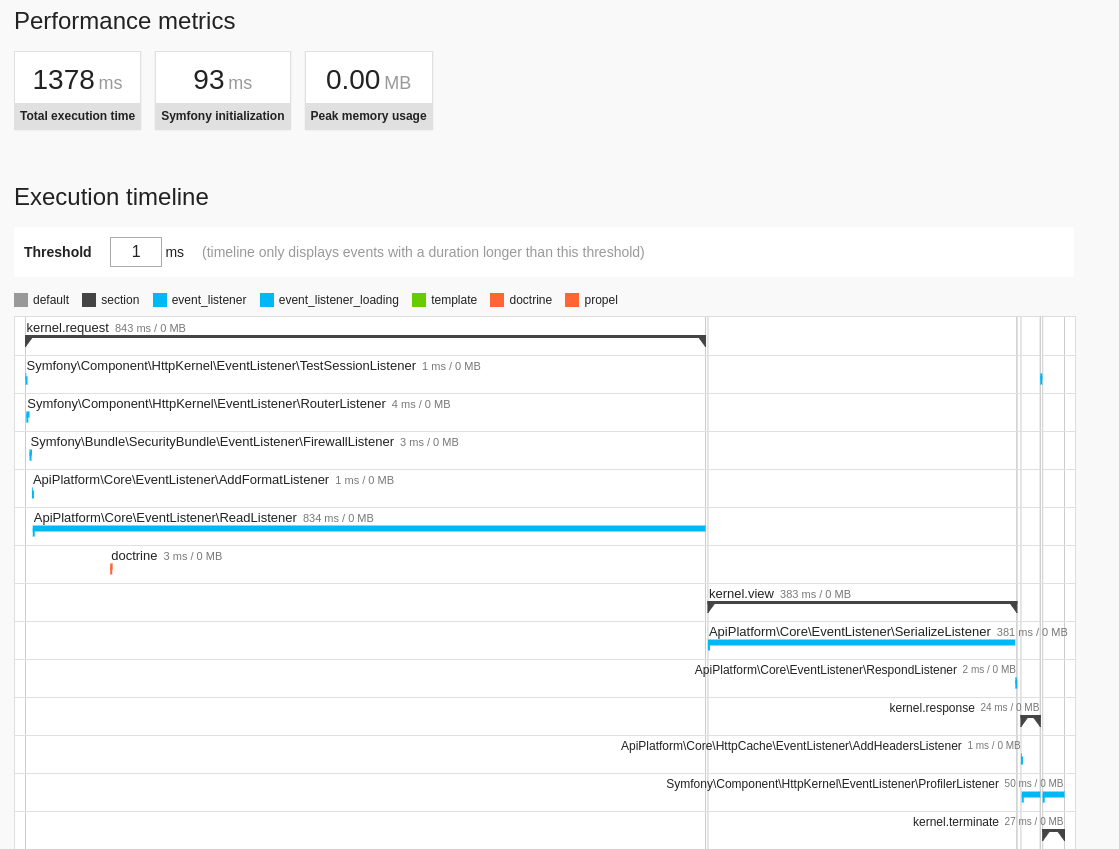
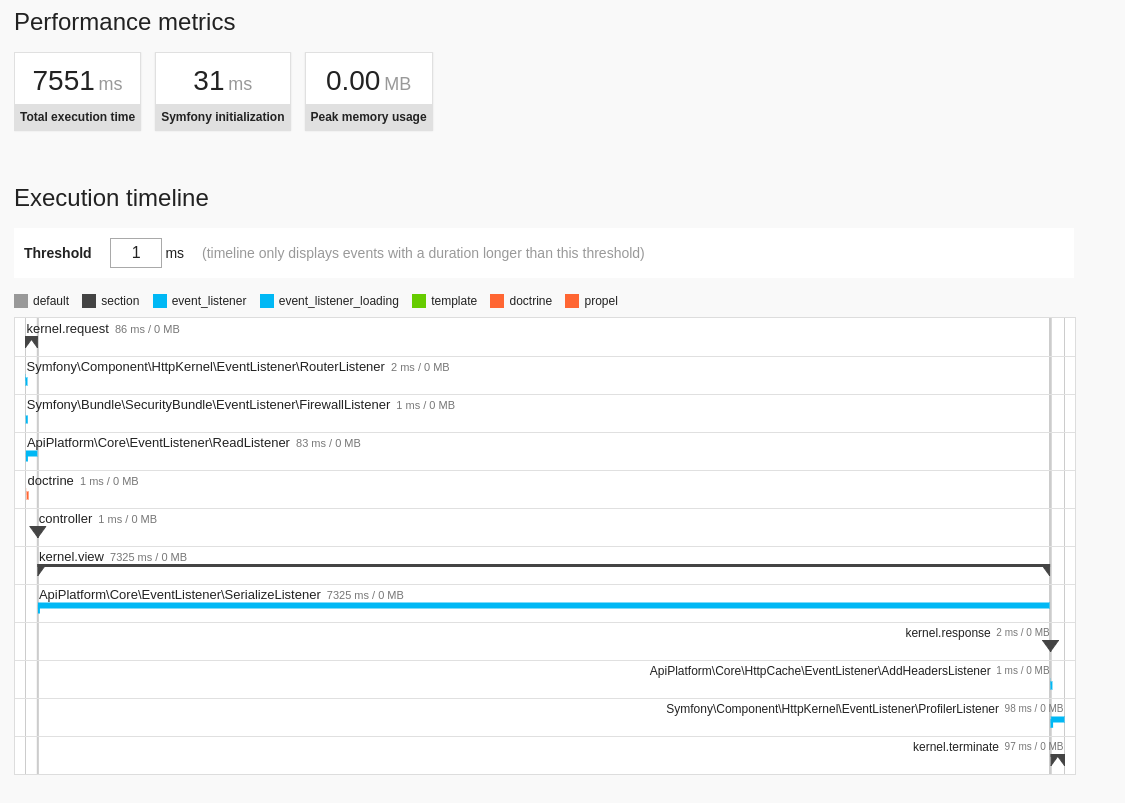
From 2.1.0-dev
raziel057
on 3 Aug 2017
From 2.0.10
raziel057
on 3 Aug 2017
that's a lot of calls to md5 and serialize
 bendavies
on 3 Aug 2017
bendavies
on 3 Aug 2017
@bendavies indeed, apparently all coming from AbstractObjectNormalizer->getCacheKey. What's weird is that the context should be keeping this key in-memory no?
soyuka
on 3 Aug 2017
This isn't really representative because I've a collection of 262 elements not 9000 :|.
And I can't test 2.0.
So, this is out of my hands because I'm using a custom normalizer. For example I retrieve a collection of 262 elements, each having 6+ relations (one of the relation is a toMany having a relation toOne). This took 1.4 sec blackfire.
I'm on master with symfony 3.3.6 but still using custom normalizers.
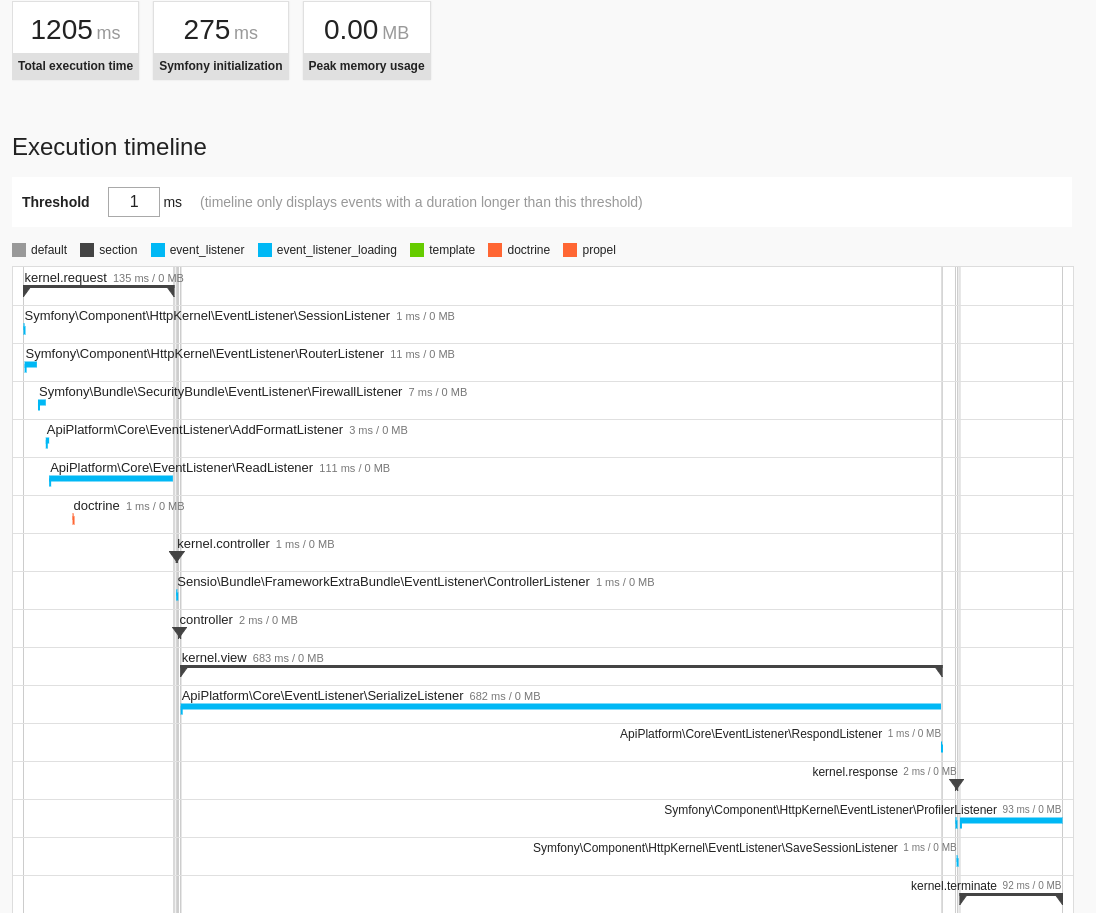
Okay because I like performances I removed my custom normalizers to do the test. So here is the same route:
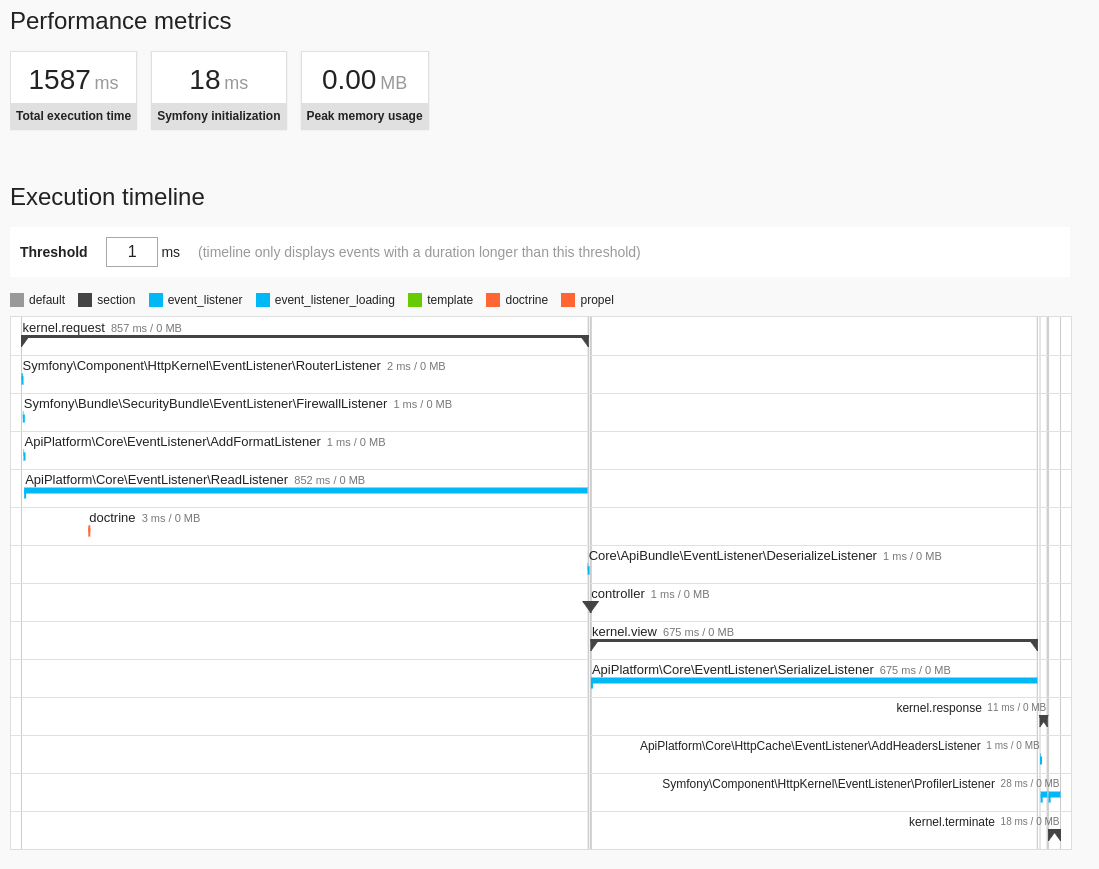
Not seeing any of those md5/serialize calls like you :|.
For those who care, here is a blackfire diff between default normalizer and normalizer dumper. Dumpers are from https://github.com/symfony/symfony/pull/22051 which I tweaked a bit and implemented my own PropertyAccessor on top of it.
soyuka
on 3 Aug 2017
Reproduced!
soyuka
on 3 Aug 2017
@soyuka it's strange if you reproduce it on 2.0 since this is on 2.1 beta did you change the vendor ? during the test
Simperfit
on 3 Aug 2017
I just changed the api-platform/core to 2.0 + composer update + rm -r cache/*
Look at the readme.
soyuka
on 3 Aug 2017
Okay so, the commit named "Builtin cache invalidation system aka make API Platform fast as hell" is actually decreasing performances by over 80% :|.
I simply used my repository from above and took over every commit we did (on a comparison 2.0...master) and tried randomly until I hit the one that is responsible for this issue. Everytime I changed the commit I launched the following script:
composer update
rm -r var/cache/*
bin/console server:stop
bin/console server:start
echo "no cache"
curl -w "Time total: %{time_total}" -o /dev/null -s "http://localhost:8001/foos.jsonld?pagination=false"
echo "cache"
curl -w "Time total: %{time_total}" -o /dev/null -s "http://localhost:8001/foos.jsonld?pagination=false"
After a couple of tries:
Commit https://github.com/api-platform/core/commit/2139c802abd52a81af7f6f16132eea55ad081e14 is the breakpoint:
"api-platform/core": "dev-master#2139c802abd52a81af7f6f16132eea55ad081e14",
Time total: 7.711412%
The commit ~1 https://github.com/api-platform/core/commit/5dc1b08ba7483f03b0148e9bfe33014acc4266e3 :
"api-platform/core": "dev-master#5dc1b08ba7483f03b0148e9bfe33014acc4266e3",
Time total: 1.659163%
Good work!
bendavies
on 3 Aug 2017
I found out the lines:
- https://github.com/api-platform/core/commit/2139c802abd52a81af7f6f16132eea55ad081e14#diff-3e45e8e6ce08f8a7cbbbda1601d5ff29R90 (6s on the above)
- https://github.com/api-platform/core/commit/2139c802abd52a81af7f6f16132eea55ad081e14#diff-459c81ea781f42965c562949a62620c3R71 (less perf decrease but 0.4s on the above)
I'm investigating further.
Wow actually it' s https://github.com/api-platform/core/blob/master/src/Serializer/AbstractItemNormalizer.php#L91
because we fill this reference
soyuka
on 4 Aug 2017
Thanks for your investigations. It's great to see that you take care of performance.
I think it's a very important part in a API platform.
raziel057
on 4 Aug 2017
Whew, so bottom story the performance leak was caused by getCacheKey.
Indeed, the responsible commit was adding every IRI to $context['resources'].
Therefore, the serializer cache key, which is based on serialize($context) was:
- taking more and more time to be computed (hence all those
md5/serializecalls) - never the same, so actually never used and always re-computed (hence all those
md5/serializecalls)
Thanks @meyerbaptiste @Simperfit for the talks around that :).
soyuka
on 4 Aug 2017
Did the #1307 solve your issue @raziel057?
meyerbaptiste
on 7 Aug 2017
I think but I would not be able to test before the 1 of September. I'm in holidays. Thanks for the fix.
raziel057
on 7 Aug 2017
@soyuka @meyerbaptiste Thanks for the fix. I just checked and it works like a charm. I don't have perf regressions anymore.
raziel057
on 30 Aug 2017
That's a good feedback, thanks !
Simperfit
on 30 Aug 2017
Related issues
 dunglas
·
3Comments
dunglas
·
3Comments
 tezvi
·
3Comments
tezvi
·
3Comments
 stipic
·
3Comments
stipic
·
3Comments
 lukasluecke
·
3Comments
lukasluecke
·
3Comments
 breitsmiley
·
3Comments
breitsmiley
·
3Comments
Most helpful comment
@soyuka @meyerbaptiste Thanks for the fix. I just checked and it works like a charm. I don't have perf regressions anymore.