Core: 15 minute restart time after 0.46 (yes 46)
Make sure you are running the latest version of Home Assistant before reporting an issue.
You should only file an issue if you found a bug. Feature and enhancement requests should go in the Feature Requests section of our community forum:
Home Assistant release (hass --version): 0.47.1 Started under 0.46
Python release (python3 --version): 3.4.2
Component/platform: restart
Description of problem:
2017-06-22 15:07:27 INFO (MainThread) [homeassistant.setup] Setup of domain input_select took 947.8 seconds.
Expected:
I don't know but it shouldn't take 15 minutes to load input_select
Problem-relevant configuration.yaml entries and steps to reproduce:
You are going to have to help me with what you need to see.
Steps to re-create - Any of the following
- Boot the server which auto loads HA
- Restart HA from the configuration window
- Restart HA from the command line "systemctl"
Traceback (if applicable):
No traceback, no error, just takes forever to load.
Additional info:
This happened around the time I went to 0.46. But around that same time, I moved all my zwave devices (approximately 50 devices) from wink to HA. I waited till we went to 0.47 and the problem did not go away. I am not sure this is related to input_select, I added some debug statements into the input_select load process and they produce the expected output as input_select entities are added, but there is not any output while waiting for "input_select" to finish loading. It "Feels like" a synchronous process is blocking and input_select just happens to be what it is blocking.
 turboc1208
All 21 comments
Hi @turboc1208, is this occurring every restart and normal start? or only when restarting? or only when you updated the HA version?
Could this problem be related to the HA database for the recorder component? (I had a similar problem with very long start times and the problem was the remote DB). I have the impression that the restore last state operation at start is taking too much time sometimes...
 azogue
on 24 Jun 2017
azogue
on 24 Jun 2017
Every restart and normal start. I use mysql for my database because of the performance issue you described.
 turbochip
on 24 Jun 2017
turbochip
on 24 Jun 2017
It is big (the DB)? When I had the problem, I was using a mysql DB in a remote NAS (was much more quicker to draw a 24h plot), but I started to experience start times of more than 10 min!
I changed to a local mysql and start times went down to 30sec. Now I'm around 90sec. I think some bad is going on with the recorder and/or the state updater, but I haven't got the opportunity to analyse...
Try to change to a sqlite (removing the uri) and watch the startup time, if is normal again, I think you can be sure that the problem is not related to the input_select
azogue
on 24 Jun 2017
If you do not truncate your database, hass startup can get slow over time.
 cmsimike
on 24 Jun 2017
cmsimike
on 24 Jun 2017
Ok, that started perfect with the db commented out. I thought HA was supposed to handle truncating and maintaining the database to keep the size issue in check....
turbochip
on 24 Jun 2017
No, you have to enable that yourself: https://home-assistant.io/components/recorder/ >purge_days
cmsimike
on 24 Jun 2017
Cool, I can do that. What exactly is the recorder database used for? The docs say history... I think I have looked at the history twice in the past year or so I've been using HA. Am I missing something? Or Can I just exclude everything, or can I turn off recorder?
turbochip
on 24 Jun 2017
I believe you can disable everything without a problem. The recorder stores each state change and event info, so unless you're interested in historic data (seeing bedroom temp over time) then the data might be useless.
cmsimike
on 24 Jun 2017
I had my db set to purge after 3 days which didn't seem to matter because my db was larger than expected. I was unable to get a fully functional hass with the recorder component enabled until I dropped and recreated the MySQL db.
I say "fully functional", because I was able to control individual devices but unable to get automations or scenes working which was a bit strange.
I'm running 0.47.1 in a docker container.
 jceloria
on 28 Jun 2017
jceloria
on 28 Jun 2017
I have done some more analysis as I am experiencing a very similar issue.
Home Assistant release (hass --version): 0.47.0
Python release (python3 --version): 3.5.2
sqlalchemy: 1.1.10
mysqld: 5.7.18-0ubuntu0.16.04.1
While a couple of months ago the startup time of my HA instance was somewhere in the area of 5-10 seconds, the startup time increased further and further and was ~3:30 minutes last week. This was a reproducible behaviour and happened on every single restart.
I noticed a gap in the log file of about 3:30 minutes where HA was not logging anything and then suddenly continued without any error message.
I also noticed that the MySQL process during this gap in the log file was constantly at 100% CPU utilisation. Before and after this gap the MySQL process is at <1%.
The recorder component is configured to log to a MySQL database running on the same server as HA.
I then turned on the MySQL query log, and found the following query that was taking a very long time to execute:
  states.state_id AS states_state_id,
  states.domain AS states_domain,
  states.entity_id AS states_entity_id,
  states.state AS states_state,
  states.attributes AS states_attributes,
  states.event_id AS states_event_id,
  states.last_changed AS states_last_changed,
  states.last_updated AS states_last_updated,
  states.created AS states_created
FROM states
INNER JOIN (
  SELECT
    max(states.state_id) AS max_state_id
  FROM states
  WHERE
    states.created >= '2017-06-27 00:25:20'
    AND states.created < '2017-06-27 09:14:52'
    AND states.domain NOT IN ('zone', 'scene')
  GROUP BY states.entity_id
) AS anon_1 ON states.state_id = anon_1.max_state_id
The states table had ~12,000,000 records. I do not have a purge rule configured, and HA is storing data since July 2016.
I followed the suggestions in the docs to exclude some sensors and domains, and deleted the corresponding entries from the states table, and brought the number of entries down to ~8,000,000.
A following restart reduced the startup time and the gap in the log file to about 1:40 mins.
Then I played around with the above SQL query directly on the database to understand what is driving up the execution time, and it appeared that it is the domain exclusion part states.domain NOT IN ('zone', 'scene').
Just by removing this exclusion the query executed in just ~1.9 seconds.
I then tried a slightly modified query:
  states.state_id AS states_state_id,
  states.domain AS states_domain,
  states.entity_id AS states_entity_id,
  states.state AS states_state,
  states.attributes AS states_attributes,
  states.event_id AS states_event_id,
  states.last_changed AS states_last_changed,
  states.last_updated AS states_last_updated,
  states.created AS states_created
FROM states
INNER JOIN (
  SELECT
    max(states.state_id) AS max_state_id
  FROM states
  WHERE
    states.created >= '2017-06-27 00:25:20'
    AND states.created < '2017-06-27 09:14:52'
  GROUP BY states.entity_id
) AS anon_1 ON states.state_id = anon_1.max_state_id
WHERE states.domain NOT IN ('zone', 'scene')
The domain exclusion constraint has now been moved from the inner query into a WHERE statement of the outer query.
The execution yields the same result as the original query, and executes in ~1.9 seconds.
The code that appears to be generating the query is in history.py:
  most_recent_state_ids = session.query(
      func.max(States.state_id).label('max_state_id')
  ).filter(
      (States.created >= run.start) &
      (States.created < utc_point_in_time) &
      (~States.domain.in_(IGNORE_DOMAINS)))
Unfortunately I have no experience with the SQLAlchemy framework, but I was hoping someone could point out whether it may be possible to modify the filter in a way that produces the improved query?
I understand that the standard answer to this issue may be to just configure a purge rule, but I have seen some people in the forum who would like to keep the historical information forever.
Also, I understand that not everyone is using MySQL as their database of choice, but I could imagine that if the framework is producing this query for MySQL, it may look very similar for other databases with a similar impact on startup time.
 exxamalte
on 29 Jun 2017
exxamalte
on 29 Jun 2017
@exxamalte thanks for your investigation!
It has been a long while since i've played DBA, but would the original query be fine if we a new index were created on(domain, created) on the state table? Without one, I feel like the filter part ends up doing full row scans to get the data it needs.
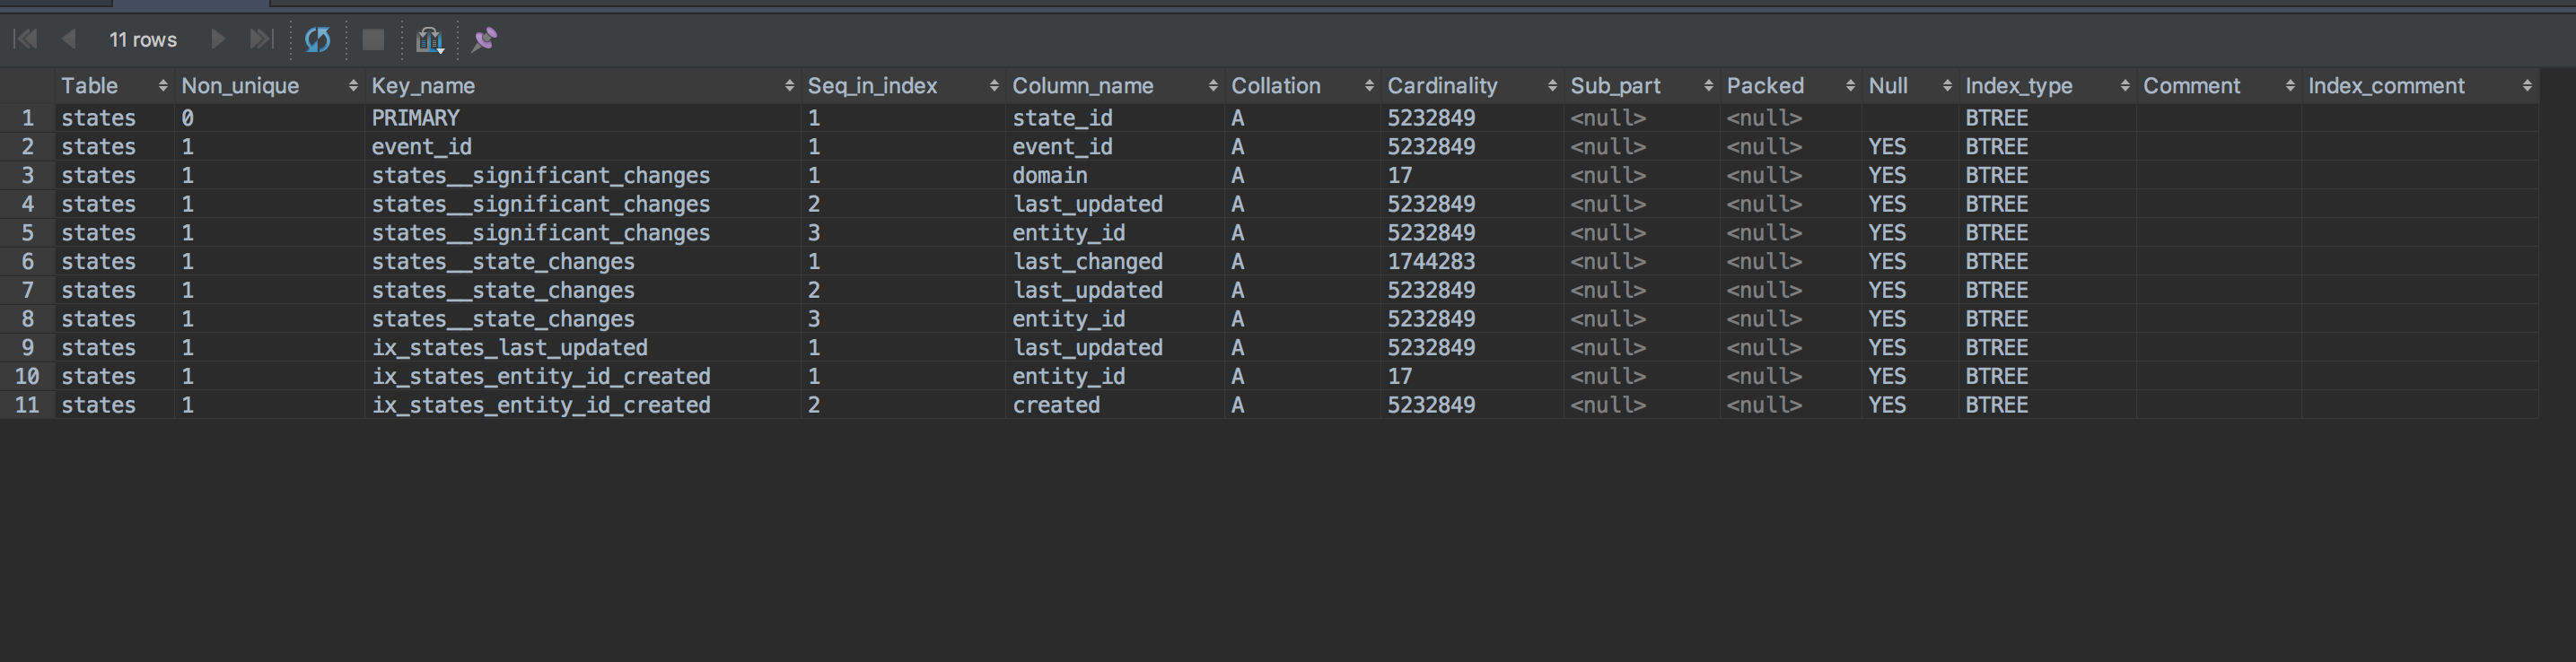
This is the current states table and the indexes setup.
I won't be able to try this until for a bit mysql but I wonder if running the mysql workbench query analyzer will give us better information about what's going on (and what, if any indices we need). I will post back if I have a better idea.
cmsimike
on 29 Jun 2017
I've done locally the changes you suggested and it works!
in components.history:get_states:
with session_scope(hass=hass) as session:
    most_recent_state_ids = session.query(
        func.max(States.state_id).label('max_state_id')
    ).filter(
        (States.created >= run.start) &
        (States.created < utc_point_in_time))

    if filters:
        most_recent_state_ids = filters.apply(
            most_recent_state_ids, entity_ids)

    most_recent_state_ids = most_recent_state_ids.group_by(
        States.entity_id).subquery()

    query = session.query(States).join(
        most_recent_state_ids,
        and_(States.state_id == most_recent_state_ids.c.max_state_id)
    ).filter(~States.domain.in_(IGNORE_DOMAINS))
My start times have dropped from ~90s to 35-40s (> 2x)!
I'll be watching some unwanted side effect of this change, I'll keep commenting.
Many thanks @exxamalte!
azogue
on 29 Jun 2017
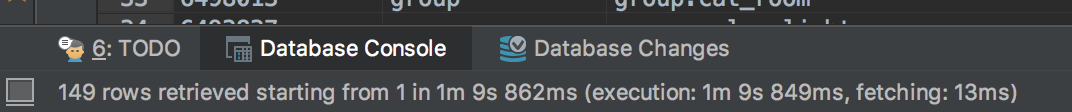
Running the unmodified query (that hass directly runs) takes 1 minute 10 seconds to run for me, with, 149 returned rows:
However adding an index on (created, domain)
ALTER TABLE
statesADD INDEXproduct_id_del_me(created,domain);
Drops the query runtime _significantly_ down to 90ms (from 1 minute to ms!!)

I am not home to try to restart hass and see if I can notice a difference there but just by looking at my tools I think this is a fix?
cmsimike
on 29 Jun 2017
Note - i named the index product_id_del_me to signify to _me_ I should delete this index as it isn't part of hass' suite.
cmsimike
on 29 Jun 2017
I tested out restarting hass and now it starts up in ~ 10 seconds.
I am calling this a fix, for me at least. I'll look into submitting a PR
cmsimike
on 30 Jun 2017
Thanks for suggesting the new index, @cmsimike.
That may be even more elegant than modifying the code. I'll give that a try tonight.
Update: New index works perfectly fine. My startup time is down to ~10 seconds again.
exxamalte
on 30 Jun 2017
Can you provide the index statement?
turboc1208
on 30 Jun 2017
@exxamalte, are you going to propose a PR? This fix could be in for v0.48
(Index definitions are here)
Thank you very much!
azogue
on 30 Jun 2017
Index statement from @cmsimike's previous post:
ALTER TABLE states ADD INDEX product_id_del_me (created, domain);
exxamalte
on 30 Jun 2017
@azogue I just opened up a PR https://github.com/home-assistant/home-assistant/pull/8255 and will work to get it merged ASAP
@exxamalte Thanks for pointing that out!
cmsimike
on 30 Jun 2017
Just looking at the query, what's the purpose of the INNER JOIN?
INNER JOIN (
  SELECT
    max(states.state_id) AS max_state_id
  FROM states
  WHERE
    states.created >= '2017-06-27 00:25:20'
    AND states.created < '2017-06-27 09:14:52'
  GROUP BY states.entity_id
) AS anon_1 ON states.state_id = anon_1.max_state_id
Couldn't the same data be pulled without doing the JOIN and just added the WHERE clauses to the primary SELECT? If I'm understanding the code right it just needs to get the "most recent" state values (based on the states.created field). Its possible I'm missing something though, based on a quick look at the code.
 cgarwood
on 30 Jun 2017
cgarwood
on 30 Jun 2017
Related issues
 Konstigt
·
3Comments
Konstigt
·
3Comments
 MartinHjelmare
·
3Comments
MartinHjelmare
·
3Comments
 YellowMonster76
·
3Comments
YellowMonster76
·
3Comments
 sh0rez
·
3Comments
sh0rez
·
3Comments
 coolriku
·
3Comments
coolriku
·
3Comments
Most helpful comment
I have done some more analysis as I am experiencing a very similar issue.
Home Assistant release (
hass --version): 0.47.0Python release (
python3 --version): 3.5.2sqlalchemy: 1.1.10
mysqld: 5.7.18-0ubuntu0.16.04.1
While a couple of months ago the startup time of my HA instance was somewhere in the area of 5-10 seconds, the startup time increased further and further and was ~3:30 minutes last week. This was a reproducible behaviour and happened on every single restart.
I noticed a gap in the log file of about 3:30 minutes where HA was not logging anything and then suddenly continued without any error message.
I also noticed that the MySQL process during this gap in the log file was constantly at 100% CPU utilisation. Before and after this gap the MySQL process is at <1%.
The recorder component is configured to log to a MySQL database running on the same server as HA.
I then turned on the MySQL query log, and found the following query that was taking a very long time to execute:
The
statestable had ~12,000,000 records. I do not have a purge rule configured, and HA is storing data since July 2016.I followed the suggestions in the docs to exclude some sensors and domains, and deleted the corresponding entries from the
statestable, and brought the number of entries down to ~8,000,000.A following restart reduced the startup time and the gap in the log file to about 1:40 mins.
Then I played around with the above SQL query directly on the database to understand what is driving up the execution time, and it appeared that it is the domain exclusion part
states.domain NOT IN ('zone', 'scene').Just by removing this exclusion the query executed in just ~1.9 seconds.
I then tried a slightly modified query:
The domain exclusion constraint has now been moved from the inner query into a
WHEREstatement of the outer query.The execution yields the same result as the original query, and executes in ~1.9 seconds.
The code that appears to be generating the query is in history.py:
Unfortunately I have no experience with the SQLAlchemy framework, but I was hoping someone could point out whether it may be possible to modify the filter in a way that produces the improved query?
I understand that the standard answer to this issue may be to just configure a purge rule, but I have seen some people in the forum who would like to keep the historical information forever.
Also, I understand that not everyone is using MySQL as their database of choice, but I could imagine that if the framework is producing this query for MySQL, it may look very similar for other databases with a similar impact on startup time.