Copyq: Become very slow when history set to 999 items
When I set the history to 999, copyq become very slow to search items.
- Create 999 history entries with size betweee 10KB to 100KB
- Open copyq main window
- Type something to search on the history
- Now, copyq will hang the main window for several seconds
Related:
- Increase History Size to 99 999 #1144
- Very slow using 3000 Items as Historic. #1202
Version, OS and Environment
- Application Version 3.9.2
- OS Windows 10
 evandrocoan
All 10 comments
I'm using 1k items without any issues. But I normally have just smaller text items.
You could try latest development version -- there were a couple of fixes for the performance.
Otherwise, not sure what should be the action item here.
 hluk
on 24 Oct 2019
hluk
on 24 Oct 2019
The next step would be benchmark the python code. You can get detailed performance per function call with this snippet. Edit the copyq code and put this benchmark snippet:
import sys

import io
import pstats
import cProfile

profiller = cProfile.Profile()
profiller.enable()

# Core here

profiller.disable()
outputstream = io.StringIO()

profiller_status = pstats.Stats( profiller, stream=outputstream )
profiller_status.sort_stats( "time" )
profiller_status.print_stats()

sys.stderr.write( outputstream.getvalue()[:2000] + '\n' )
Running this solemnly will output:
         1 function calls in 0.000 seconds

   Ordered by: internal time

      ncalls     tottime     percall     cumtime     percall filename:lineno(function)
           1       0.000       0.000       0.000       0.000 {method 'disable' of '_lsprof.Profiler' objects}
Adding a few cool stuff inside it like:
import mmap
import json

# https://docs.python.org/3.9/library/mmap.html
# https://blog.askesis.pl/post/2019/02/mmap.html
memory = mmap.mmap( -1, 20, access=mmap.ACCESS_WRITE )
memory.write( b'{ "var": 10 }' )

end_of_the_file = memory.tell()
print( 'memory {:,}, end_of_the_file {}\n'.format( len( memory ), end_of_the_file ) )

memory.seek( 0 )
print( 'raw', memory.read( end_of_the_file ) )

memory.seek( 0 )
loaded = json.loads( memory.read( end_of_the_file ) )

print( 'json', loaded )
print( 'loaded', memory[:end_of_the_file] )
Will output:
         3,031 function calls (2,921 primitive calls) in 0.006 seconds

   Ordered by: internal time

      ncalls     tottime     percall     cumtime     percall filename:lineno(function)
          17       0.001       0.000       0.001       0.000 {built-in method nt.stat}
        15/6       0.000       0.000       0.001       0.000 F:\Python\lib\sre_parse.py:475(_parse)
           4       0.000       0.000       0.000       0.000 {built-in method marshal.loads}
           4       0.000       0.000       0.000       0.000 <frozen importlib._bootstrap_external>:914(get_data)
           4       0.000       0.000       0.001       0.000 <frozen importlib._bootstrap_external>:793(get_code)
        25/6       0.000       0.000       0.000       0.000 F:\Python\lib\sre_compile.py:71(_compile)
           4       0.000       0.000       0.000       0.000 {method 'read' of '_io.FileIO' objects}
          14       0.000       0.000       0.000       0.000 F:\Python\lib\sre_compile.py:276(_optimize_charset)
           6       0.000       0.000       0.001       0.000 <frozen importlib._bootstrap_external>:1356(find_spec)
           4       0.000       0.000       0.000       0.000 {built-in method builtins.print}
         102       0.000       0.000       0.000       0.000 F:\Python\lib\sre_parse.py:233(__next)
       31/12       0.000       0.000       0.000       0.000 F:\Python\lib\sre_parse.py:174(getwidth)
           3       0.000       0.000       0.000       0.000 {built-in method builtins.__build_class__}
           2       0.000       0.000       0.000       0.000 {built-in method _imp.create_builtin}
         6/2       0.000       0.000       0.006       0.003 <frozen importlib._bootstrap>:978(_find_and_load)
         123       0.000       0.000       0.000       0.000 F:\Python\lib\sre_parse.py:164(__getitem__)
          39       0.000       0.000       0.000       0.000 {method 'format' of 'str' objects}
           1       0.000       0.000       0.000       0.00
This should show in which black whole the performance is dropping in.
evandrocoan
on 25 Oct 2019
The next step would be benchmark the python code.
Well, CopyQ is written in C++.
I have a way I measure performance (trace function/method calls). The problem is that I don't really know where to look since I don't notice any performance issues.
You can try checking if this is rendering issue, by disabling some plugins (in configuration, under Item tab), or checking size of data files used by CopyQ (something like ls -lh ~/.config/copyq/).
hluk
on 25 Oct 2019
I cannot believe it. Everything was fixed 100% when I deleted the libitemtext.dll file from my plugins directory. Now, what this libitemtext.dll plugin is doing to keep everything thousand times slow?
evandrocoan
on 27 Oct 2019
The Text plugin you deleted allows rendering HTML and bigger text items. The performance of the Qt Widget is not great if there is a lot of text to layout (there are many fixes and workarounds I had to implement make to performance better).
You might be able to achieve the same be disabling HTML rendering in the Text plugin. Disabling it completely means, among others, that you'll also lose search highlighting in the items.
Maybe I could also add an option so the plugin avoids managing larger items.
hluk
on 27 Oct 2019
I already got that HTML thing disabled since few years back. So, the HTML is not cause the lags:
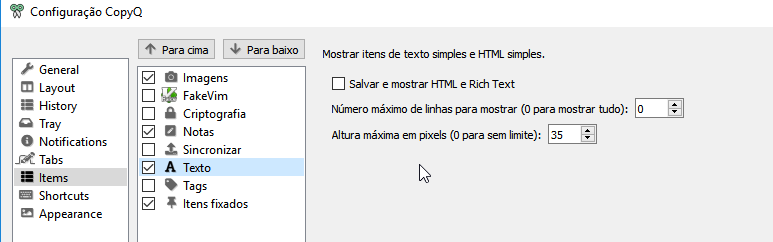
I only need that plugin to show the first 3 lines of the contents. After that, it could show a ellipsis (...) and if I click on it, it would open a new Window showing the full contents of that item.
This is certainly the cause the lag/slowness. Qt is rendering all my 999 items, which has a big size each.
evandrocoan
on 27 Oct 2019
Here is suggestion to fix this, by removing the scrollbar and adding the ellipsis (...) in the place of it

After hitting the ellipsis, it should open a window showing the full contents.
evandrocoan
on 27 Oct 2019
Alternatively, it should show how many lines it is hiding:

evandrocoan
on 27 Oct 2019
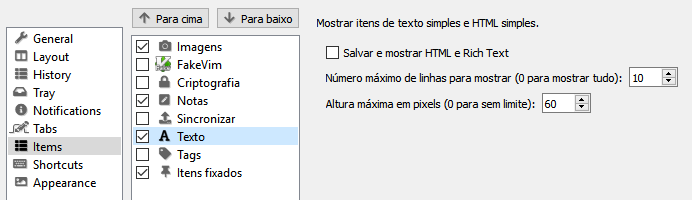
Did you try to limit the numbers of lines in Text plugin options? It should show the ellipsis.
hluk
on 27 Oct 2019
No. But now I set it to 10 and it is fixed! Thanks!
evandrocoan
on 27 Oct 2019
Related issues
 ujay68
·
9Comments
ujay68
·
9Comments
 SmileyStiles
·
3Comments
SmileyStiles
·
3Comments
 Gitoffthelawn
·
8Comments
Gitoffthelawn
·
8Comments
 lepalmtree
·
7Comments
lepalmtree
·
7Comments
 bsucker98
·
4Comments
bsucker98
·
4Comments
Most helpful comment
Well, CopyQ is written in C++.
I have a way I measure performance (trace function/method calls). The problem is that I don't really know where to look since I don't notice any performance issues.
You can try checking if this is rendering issue, by disabling some plugins (in configuration, under Item tab), or checking size of data files used by CopyQ (something like
ls -lh ~/.config/copyq/).