Consul: Cluster becomes unresponsive and does not elect new leader after disk latency spike on leader
Description of the Issue (and unexpected/desired result)
Two times in a week, we've now had a situation where the leader node's VM experienced high cpu iowait levels for a few (~3) minutes, and disk latencies of 800+ milliseconds. This seems to lead to writes to the log failing and getting retried indefinitely, even after disk access times are back to normal. During this time, it spews lines to the log like consul.kvs: Apply failed: timed out enqueuing operation (and also for consul.session). For some reason, this does not trigger a leader election.
It appears incoming connections are enqueued, until all file descriptors are consumed. Restarting the Consul service seems to be the only way to recover. The non-leader servers also run out of fd:s at about the same time.
So, some questions here: Why does this not trigger a leader election already when the timeouts start happening? And why can Consul not recover after a few minutes of high disk latency?
(Regarding the reason for the iowait, we're hosted in a public cloud, and according to the provider there is a possibility for other tenants to consume high amounts of IO when booting new VMs. They are working on thottling this in a good way, but regardless, Consul should handle this better)
consul version
Server: v0.8.2
consul info
Server:
agent:
        check_monitors = 2
        check_ttls = 1
        checks = 13
        services = 14
build:
        prerelease =
        revision = 6017484
        version = 0.8.2
consul:
        bootstrap = false
        known_datacenters = 2
        leader = false
        leader_addr = 192.168.123.116:8300
        server = true
raft:
        applied_index = 249572007
        commit_index = 249572007
        fsm_pending = 0
        last_contact = 39.594µs
        last_log_index = 249572008
        last_log_term = 6062
        last_snapshot_index = 249567365
        last_snapshot_term = 6062
        latest_configuration = [{Suffrage:Voter ID:192.168.123.118:8300 Address:192.168.123.118:8300} {Suffrage:Voter ID:192.168.123.116:8300 Address:192.168.123.116:8300} {Suffrage:Voter ID:192.168.123.154:8300 Address:192.168.123.154:8300}]
        latest_configuration_index = 45140126
        num_peers = 2
        protocol_version = 2
        protocol_version_max = 3
        protocol_version_min = 0
        snapshot_version_max = 1
        snapshot_version_min = 0
        state = Follower
        term = 6062
runtime:
        arch = amd64
        cpu_count = 4
        goroutines = 446
        max_procs = 4
        os = linux
        version = go1.8.1
serf_lan:
        encrypted = true
        event_queue = 0
        event_time = 3818
        failed = 0
        health_score = 0
        intent_queue = 0
        left = 0
        member_time = 2318
        members = 54
        query_queue = 0
        query_time = 69
serf_wan:
        encrypted = true
        event_queue = 0
        event_time = 1
        failed = 0
        health_score = 0
        intent_queue = 0
        left = 0
        member_time = 232
        members = 6
        query_queue = 0
        query_time = 28
(This is post-restart of the server, so not sure if it is much use)
Operating system and Environment details
Centos 7.2, Openstack VM
 carlpett
All 52 comments
@armon @slackpad This has been happening us _a lot_ lately while our hosting provider works on their storage, and seems like a critical bug? We built most of our systems to cope with losing Consul a while, but for those relying more on Consul, it is extremely disturbing.
Any idea what it could be? Anything I can do to help explaining it better?
carlpett
on 12 Oct 2017
Hi @carlpett we tracked this down to a code bug and the fix for this will be released in 1.0, hopefully early next week - https://github.com/hashicorp/consul/issues/3545.
 slackpad
on 12 Oct 2017
slackpad
on 12 Oct 2017
Fantastic, thank you!
carlpett
on 12 Oct 2017
Hi @slackpad, we're still seeing this when running 1.0.0. What can I do to help you track down the cause?
 christoe
on 31 Oct 2017
christoe
on 31 Oct 2017
Hi @christoe I'll kick this open - can you provide some log output from the Consul servers when you get into a bad state?
slackpad
on 1 Nov 2017
Happened again yesterday. This time we can't seem to see any indications on high iowait though, but all the symptoms are identical to what we've seen before.
Unfortunately there are no logs that seem to explain what's happening. The first indication that something is wrong:
consul: error getting server health from "<consul cluster server>": context deadline exceeded
[...]
consul: error getting server health from "<consul cluster server>": last request still outstanding
[...]
memberlist: Marking <consul member> as failed, suspect timeout reached (2 peer confirmations)
serf: EventMemberFailed: <consul member> <ip address>
consul: member '<consul member>' failed, marking health critical
serf: EventMemberJoin: <consul member> <ip address>
consul: member '<consul member>' joined, marking health alive
[...]
consul.kvs: Rejecting lock of <kv lock path> due to lock-delay until 2017-11-06 16:01:00
memberlist: Failed fallback ping: read tcp <consul server ip>:58940-><consul member ip>:8301: i/o timeout
agent: Check 'vault:<consul server ip>:8200:vault-sealed-check' missed TTL, is now critical
After this, the consul just spews timeout messages until the Consul leader is restarted:
consul.session: Apply failed: timed out enqueuing operation
consul.kvs: Apply failed: timed out enqueuing operation
[...]
During this time, the Consul cluster is completely disfunct. As Carl described above, we think that Consul enqueues operations until all of the cluster servers run out of fds. Total number of fd:s allocated on the Consul server nodes below (big drop when restarting the "leader" node):

christoe
on 7 Nov 2017
Can't seem to find any metrics that indicate something is wrong. We see quite a lot of member flapping a little while before the cluster acts out. Also (don't know if its helpful or not) we can see Raft FSM pending tasks increasing at the time when the cluster starts behaving bad:

christoe
on 7 Nov 2017
Hi @christoe thanks for the additional info. Can you use something like lsof to see what kind of FDs are accumulating? I'd be curious if you have heavy inbound client traffic during these times (lots of TCP connections to :8500) or if there's something happening at the RPC/Raft layer (TCP connections to :8300), or if it's something else.
slackpad
on 8 Nov 2017
Hi @slackpad, sure - I can try to do that next time the cluster breaks down. However, it seems as if the fd depletion is more of an effect of the cluster being broken, rather than the cause (the cluster broke down ~15:02 on the graphs above).
christoe
on 8 Nov 2017
Hi again @slackpad! The cluster broke down again this weekend (feels as if 1.0.0 is worse than before) and I managed to get a list of open fd:s. There are two categories that stick out:
Localhost to localhost:8500:
consul-ag 907 consul 6u IPv6 1277992252 0t0 TCP localhost:59218->localhost:8500 (ESTABLISHED)
And ipv6-sockets:
consul-ag 907 consul 7u sock 0,6 0t0 1277993586 protocol: TCPv6
Together, these make up almost all of the to user consul 1024 available fd:s.
christoe
on 15 Nov 2017
Hey guys, we have also been seeing errors of this sort. Our cluster will go several days without any issues, and then we will suddenly get a slew of errors like:
Nov 21 22:02:30 consul3 consul[2075]: consul.kvs: Apply failed: timed out enqueuing operation
Nov 21 22:02:30 consul3 consul[2075]: consul.kvs: Apply failed: timed out enqueuing operation
Most requests to vault/consul start returning 503's at that point until we kill the consul leader node. After consul elects a new leader, activity returns to normal. I have not been able to verify if this was connected to a fd overflow though.
This is affecting our production environment, does anyone know if there is a version of consul that is not impacted by this issue?
Also, I expect this to happen again since this is the third time, if there are any diagnostics you'd like me to run the next time it happens, I would be happy to.
 MaxFlanders
on 22 Nov 2017
MaxFlanders
on 22 Nov 2017
Hi @326TimesBetter and @christoe this looks very similar to https://github.com/hashicorp/consul/issues/3700 which we were able to reproduce during our 1.0.1 release testing and get a fix in 1.0.1. If you can try again with 1.0.1 I'd appreciate it.
If you still see problems the best thing is probably to turn on https://www.consul.io/docs/agent/options.html#enable_debug and then save off the contents of /debug/pprof/goroutine?debug=1 on all three servers when they get into a bad state.
slackpad
on 22 Nov 2017
We are working on upgrading our consul servers to 1.0.1 right now. Does this require us to upgrade all consul agents as well??
MaxFlanders
on 22 Nov 2017
For the fix in #3700 you just need the servers at 1.0.1.
slackpad
on 22 Nov 2017
Thank you @slackpad we have upgraded our servers and also enabled debugging so if it happens again we can dump that endpoint.
It has usually taken 2-4 days in between these types of crashes so we won't be able to be confident for a while, but I will definitely get back to you here.
MaxFlanders
on 22 Nov 2017
Thanks @slackpad, I too will install 1.0.1 on our servers and get back to you with the results!
christoe
on 23 Nov 2017
@slackpad I am happy to say that we have not had another indicent in which our consul leaders crashed since we upgraded our servers to 1.0.1.
MaxFlanders
on 1 Dec 2017
We're also cautiously optimistic. Consul has been running without a restart since the upgrade to 1.0.1 - even with quite a few I/O-wait peaks. Thanks @slackpad!
christoe
on 13 Dec 2017
Is it possible that in a large (~1000 nodes) and busy cluster that once this behavior had started it would persist even after leadership change. This cluster was upgraded to 1.0.0 on the 11th December.
We saw consul.kvs: Apply failed: timed out enqueuing operation and a huge jump in system utilization. Repeatedly moving leadership didn't fix the issue, also upgrading to 1.0.1 during this time didn't solve the issue.
During this period consul info on agents could take minutes to run, agents were unable to update the catalog so our ability to service discovery was impacted and containerpilot health checks started to fail as they could not register.
Eventually we had to shutdown the cluster, clean out the data directory and restart. The KV store was restored from snapshot and we haven't had a repeat of this in the subsequent two days running on version 1.0.1.
 nickwales
on 17 Dec 2017
nickwales
on 17 Dec 2017
We are currently seeing this on a cluster that has been upgraded to 1.0.1. I have collected some data here: https://gist.github.com/nickwales/deed318a6296b709cf5f3f57096feb98
I have destroyed and restored the cluster twice now but we immediately end up in the same situation with huge load on the leader and this repeated on the follower servers.
2018/01/05 14:23:43 [WARN] consul: error getting server health from "ip-10-122-4-24": context deadline exceeded
2018/01/05 14:23:44 [WARN] consul: error getting server health from "ip-10-122-10-181": last request still outstanding
Update, pulled a heap with enable_debug turned on: https://gist.github.com/0cf3c3ff50f2ebd2dbae58c66324fb9a
Update 2, downgraded servers to 0.8.3 and we're back in business.
Of note during the outage, running consul info on 0.8.3 agents responded immediately, on 1.0.2 agents in particular it could hang for anything up to a minute. 1.0.1 seemed somewhere in the middle.
nickwales
on 5 Jan 2018
@slackpad thanks for looking into this.
Is there a way we can replicate the behavior? It seems to come out of nowhere.
We're able to help test any bug fixes you're working on.
nickwales
on 16 Jan 2018
We are seeing similar issue - log below
our cluster is auto fixing itself, but becomes shortly unavailable while the snapshotting is going on. Resulting in DNS lookup errors and other weird errors. The snapshotting errors are identical across all 3 consul servers.
We run 1.0.2 - We use Vault with Consul storage, other than that, we have ~0 KV usage, but quite a lot of Nomad managed services in the catalog.
We see this happening across all servers at the same time
update 18/01/2017: we increased EBS iops throughput and seem to have helped a bit, we no longer
see context deadline exceeded errors during snapshot every snapshot - only a few. I've now increased our EBS throughput even further now, and will continue to monitor
<everything is fine>

    2018/01/17 18:02:13 [INFO] consul.fsm: snapshot created in 34.78µs
    2018/01/17 18:02:13 [INFO] raft: Starting snapshot up to 61121994
    2018/01/17 18:02:13 [INFO] snapshot: Creating new snapshot at /var/lib/consul/raft/snapshots/840-61121994-1516212133883.tmp
2018/01/17 18:02:30 [DEBUG] raft-net: xx:8300 accepted connection from: xx:36784
2018/01/17 18:02:39 [ERR] raft-net: Failed to flush response: write tcp xx:8300->10.30.133.230:47810: write: broken pipe
    2018/01/17 18:02:39 [INFO] snapshot: reaping snapshot /var/lib/consul/raft/snapshots/840-61105602-1516208516094
    2018/01/17 18:02:39 [INFO] raft: Compacting logs from 61103626 to 61111838
    2018/01/17 18:02:39 [INFO] raft: Snapshot to 61121994 complete
    2018/01/17 18:02:40 [WARN] consul: error getting server health from "hashi-i-005ddf0dc28dda9ff": context deadline exceeded
    2018/01/17 18:02:40 [WARN] consul: error getting server health from "hashi-i-01a40609760b44613": context deadline exceeded
    2018/01/17 18:02:40 [WARN] consul: error getting server health from "hashi-i-005ddf0dc28dda9ff": last request still outstanding
    2018/01/17 18:02:41 [WARN] consul: error getting server health from "hashi-i-0ebe00577f5c4e7dd": context deadline exceeded
    2018/01/17 18:02:41 [WARN] consul: error getting server health from "hashi-i-01a40609760b44613": context deadline exceeded
    2018/01/17 18:02:41 [WARN] consul: error getting server health from "hashi-i-005ddf0dc28dda9ff": last request still outstanding
    2018/01/17 18:02:41 [WARN] consul: error getting server health from "hashi-i-0ebe00577f5c4e7dd": last request still outstanding
    2018/01/17 18:02:42 [WARN] consul: error getting server health from "hashi-i-005ddf0dc28dda9ff": last request still outstanding
    2018/01/17 18:02:42 [WARN] consul: error getting server health from "hashi-i-0ebe00577f5c4e7dd": last request still outstanding
    2018/01/17 18:02:44 [WARN] consul: error getting server health from "hashi-i-005ddf0dc28dda9ff": last request still outstanding
    2018/01/17 18:02:44 [WARN] consul: error getting server health from "hashi-i-0ebe00577f5c4e7dd": last request still outstanding
    2018/01/17 18:02:46 [WARN] consul: error getting server health from "hashi-i-005ddf0dc28dda9ff": last request still outstanding
    2018/01/17 18:02:46 [WARN] consul: error getting server health from "hashi-i-0ebe00577f5c4e7dd": last request still outstanding
    2018/01/17 18:02:48 [WARN] consul: error getting server health from "hashi-i-005ddf0dc28dda9ff": last request still outstanding

<everything is fine>
consul config
{
  "advertise_addr": "xx",
  "bind_addr": "0.0.0.0",
  "bootstrap_expect": 3,
  "client_addr": "0.0.0.0",
  "data_dir": "/var/lib/consul/",
  "datacenter": "xx",
  "disable_remote_exec": true,
  "disable_update_check": true,
  "dns_config": {
    "allow_stale": true,
    "node_ttl": "60s",
    "only_passing": true,
    "service_ttl": {
      "*": "10s"
    }
  },
  "domain": "xx",
  "enable_syslog": true,
  "leave_on_terminate": true,
  "node_meta": {
    "aws_instance_availability-zone": "us-east-1c",
    "aws_instance_family": "m4",
    "aws_instance_life-cycle": "normal",
    "aws_instance_region": "xxx",
    "aws_instance_root-device-type": "ebs",
    "aws_instance_type": "m4.xlarge"
  },
  "node_name": "hashi-i-01a40609760b44613",
  "performance": {
    "raft_multiplier": 1
  },
  "rejoin_after_leave": true,
  "retry_join": [
    "provider=xx tag_key=xx tag_value=xxx"
  ],
  "server": true,
  "skip_leave_on_interrupt": false,
  "telemetry": {
    "dogstatsd_addr": "127.0.0.1:8125",
    "dogstatsd_tags": [
      "environment:performance"
    ]
  },
  "ui": true
}
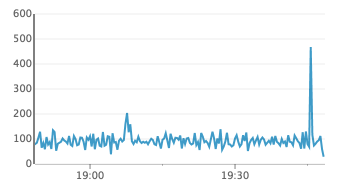
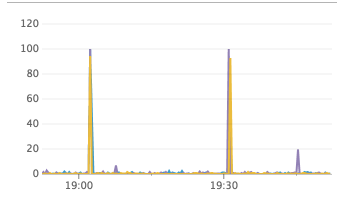
the events happened at the black line in the chart - the events earlier in the day was me replacing the cluster to try and debug it, so those can safely be ignored.
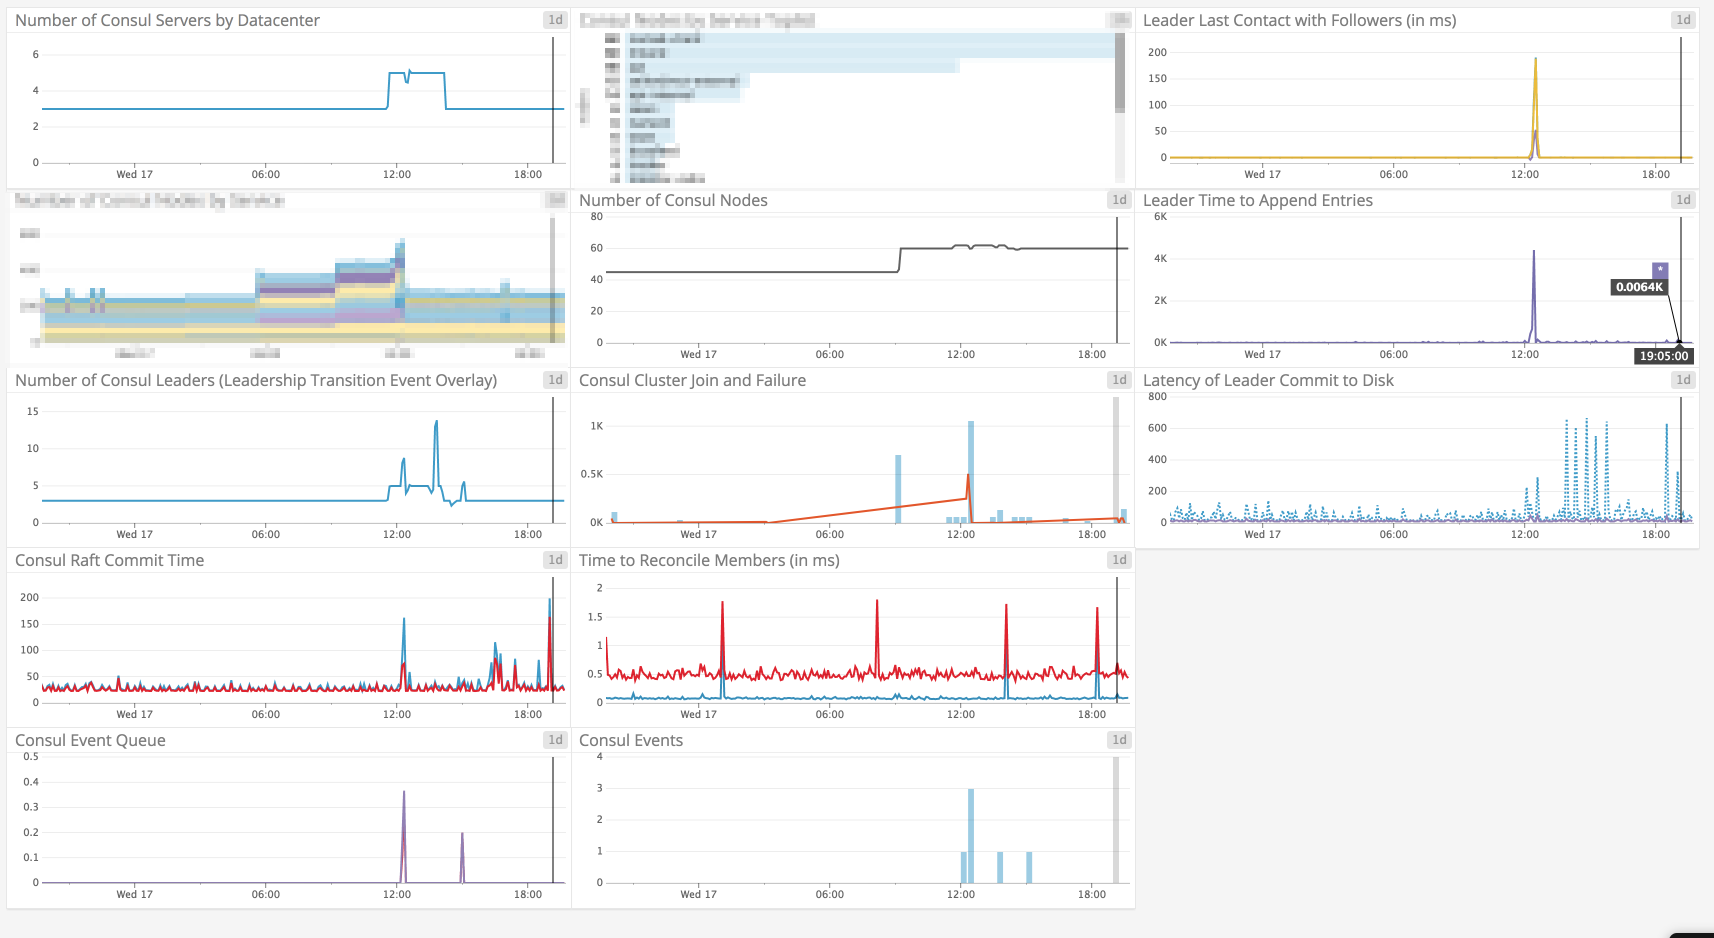
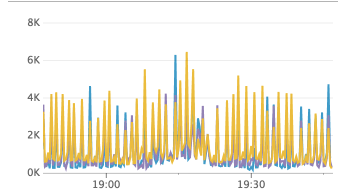
Charts below is in UTC+1, so 19:02 in the chart correspond to the 18:02 event from the logs above
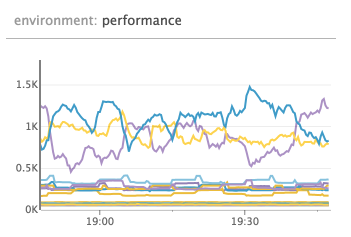
RPC queries
num go routines
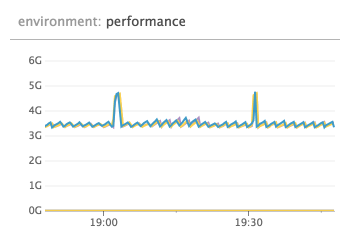
alloc bytes
raft apply
disk io util (%)
99.6% io util
 jippi
on 17 Jan 2018
jippi
on 17 Jan 2018
Hi @nickwales and @jippi sorry for the delayed response.
@nickwales it does look like writes stalled. The consul info is probably delayed because anti-entropy sync is stuck holding the lock and things are stuck waiting for a lock in https://github.com/hashicorp/consul/blob/v1.0.2/agent/local/state.go#L567 which is called when fetching /v1/agent/self. It would be super helpful if you could enable_debug and then get a goroutine (instead of heap) dump when things are stuck on the current leader. This would help pinpoint if there's some other deadlock similar to #3700 that's happening. It might also help to snag a copy of metrics from /v1/agent/metrics on the leader as well. I looked over the rest of the data and didn't see anything super unusual, other than fsm_pending = 110 on the leader, which seems high for pending write operations to the FSM, and also looks like something is stuck in a similar fashion to #3700.
@jippi please keep me posted. The snapshots are written to the same directory as the Raft log, so if that was nuking your disk IOPs then I could see things getting slow fetching the Raft stats.
slackpad
on 20 Jan 2018
Thanks for getting back to me @slackpad, have added the goroutine dump to our runbook for when / if this happens again.
I have all the telemetry data stored in datadog currently, is there anything in particular that would be of use for failure time period and I can try to make it available.
Also, is there a version of Consul that we can confirm won't have this issue? We'd really like to run production on one that isn't a ticking time bomb!
nickwales
on 20 Jan 2018
I have all the telemetry data stored in datadog currently, is there anything in particular that would be of use for failure time period and I can try to make it available.
It would be interesting to see what's happening with consul.raft.fsm.apply to see when that starts to back up / what your steady state looks like. It would also be interesting to plot all the consul.fsm.* metrics to see what kind of write activity is happening.
Also, is there a version of Consul that we can confirm won't have this issue? We'd really like to run production on one that isn't a ticking time bomb!
Most definitely. I would have said 1.0.1 for #3700 since it looks like a very similar failure mode, but it's possible there is some other kind of deadlock you are hitting. It would be good to double check your disk performance and network performance to make sure you aren't hitting some kind of issue there that's killing writes, though I wouldn't expect a failure there to lead to a lot of CPU like you are describing, but it's worth a double check.
slackpad
on 20 Jan 2018
We moved to 1.0.6 and all of this got resolved :)
jippi
on 6 Mar 2018
@jippi can you confirm how long you've been running 1.0.6 without issue to decide it is resolved?
We're happy to hear you're not seeing issues any more but since we still don't have a full understanding of the failures after the fixes in 1.0.0 and 1.0.1, we're cautious about closing this early.
@nickwales do you continue to see this issue since last update in January? If not, which version are you settled on?
Thanks.
 banks
on 14 Mar 2018
banks
on 14 Mar 2018
@banks since ~12th of February :)
jippi
on 14 Mar 2018
Hello,
I have just upgraded consul from 0.7.5 to latest 1.0.6 and i encountered this issue also. The upgrade has been done only to the servers, the clients are still at 0.7.5 since i saw the error. The errors/issue appears only on the leader node.
consul-server-1-gls-dus10-ci-efood-real-de.log
consul-server-1-gls-dus21-ci-efood-real-de.log
consul-server-2-gls-dus10-ci-efood-real-de.log
consul-server-2-gls-dus21-ci-efood-real-de.log
consul-server-3-gls-dus21-ci-efood-real-de.log
The raft protocol used is 2 because of the lower Consul version of the agents.
 m4rcc
on 21 Mar 2018
m4rcc
on 21 Mar 2018
@banks We're currently running 1.0.1 in dev and test and 0.8.3 in stage and production.
Dev and Test have never had an outage.
- Production had an outage in December, 11 days after upgrading from 0.8.3 to 1.0.0, during the outage we upgraded from 1.0.0 to 1.0.1 and the outage resolved.
- Stage then had an issue in January while running 1.0.1
At this point we were nervous about running 1.0.x in customer facing environments so decided to downgrade those two environments to the previous version of 0.8.3.
We kept dev and test at 1.0.1 in an effort to provide the core dumps should we see a failure but I don't have any to report currently.
nickwales
on 22 Mar 2018
can we somehow increase timeouts to deal with this issue?
https://github.com/hashicorp/consul/blob/master/agent/consul/config.go#L428-L429
like
"consul": {
  "server": {
    "health_interval": 10
  }
}
 avoidik
on 13 Apr 2018
avoidik
on 13 Apr 2018
I've tried to downgrade raft_protocol to v2, re-spun the cluster and it seems that this problem has gone, I have only 1.0.6 in consul members
faced https://github.com/hashicorp/consul/issues/3361 during upgrade
avoidik
on 13 Apr 2018
We are seeing this with consul 1.0.2. Five servers setup.
2018/05/12 03:47:47 [DEBUG] manager: Rebalanced 5 servers, next active server is xxx (Addr: tcp/11.1.5.51:27039) (DC: dc1)
2018/05/12 03:47:50 [DEBUG] memberlist: Initiating push/pull sync with: 11.1.4.123:xxx
2018/05/12 03:47:50 [DEBUG] memberlist: Stream connection from=11.1.5.51:xxx
2018/05/12 03:47:51 [DEBUG] http: Request GET /v1/status/leader (33.952µs) from=11.1.5.61:xxx
2018/05/12 03:47:51 [DEBUG] http: Request GET /v1/operator/autopilot/health (1.074998ms) from=11.1.5.61:xxx
2018/05/12 03:47:54 [WARN] consul: error getting server health from "xxx": context deadline exceeded
2018/05/12 03:47:55 [WARN] consul: error getting server health from "xxx": last request still outstanding
2018/05/12 03:47:55 [DEBUG] http: Request GET /v1/operator/autopilot/health (942.004µs) from=127.0.0.1:xxx
Received task health update, healthy: false
2018/05/12 03:47:57 [WARN] consul: error getting server health from "xxx": last request still outstanding
2018/05/12 03:47:59 [WARN] consul: error getting server health from "xxx": last request still outstanding
2018/05/12 03:48:01 [DEBUG] http: Request GET /v1/status/leader (30.218µs) from=11.1.5.61:xxx
2018/05/12 03:48:01 [DEBUG] http: Request GET /v1/operator/autopilot/health (946.665µs) from=11.1.5.61:xxx
2018/05/12 03:48:01 [WARN] consul: error getting server health from "xxx": last request still outstanding
2018/05/12 03:48:01 [DEBUG] Skipping remote check "serfHealth" since it is managed automatically
2018/05/12 03:48:01 [DEBUG] agent: Node info in sync
2018/05/12 03:48:03 [WARN] consul: error getting server health from "xxx": last request still outstanding
2018/05/12 03:48:05 [WARN] consul: error getting server health from "xxx": last request still outstanding
2018/05/12 03:48:05 [DEBUG] http: Request GET /v1/operator/autopilot/health (1.016149ms) from=127.0.0.1:xxx
Received task health update, healthy: false
2018/05/12 03:48:06 [DEBUG] http: Request GET /v1/status/leader (34.273µs) from=11.1.4.191:xxx
2018/05/12 03:48:07 [WARN] consul: error getting server health from "xxx": last request still outstanding
2018/05/12 03:48:09 [WARN] consul: error getting server health from "xxx": last request still outstanding
2018/05/12 03:48:11 [DEBUG] http: Request GET /v1/status/leader (35.576µs) from=11.1.5.61:xxx
2018/05/12 03:48:11 [DEBUG] http: Request GET /v1/operator/autopilot/health (1.027931ms) from=11.1.5.61:xxx
2018/05/12 03:48:11 [WARN] consul: error getting server health from "xxx": last request still outstanding
2018/05/12 03:48:13 [WARN] consul: error getting server health from "xxx": last request still outstanding
2018/05/12 03:48:15 [WARN] consul: error getting server health from "xxx": last request still outstanding
2018/05/12 03:48:15 [DEBUG] http: Request GET /v1/operator/autopilot/health (897.07µs) from=127.0.0.1:xxx
Received task health update, healthy: false
Received killTask for task consul-framework.consul-1.b586c018-8e6c-4c63-856f-17f08147f16a
This is happening on three nodes simultaneously and makes the cluster fail.
 jacob-koren-zooz
on 13 May 2018
jacob-koren-zooz
on 13 May 2018
@jacob-koren-zooz thanks for the info can you confirm if your failure occurs following a disk IO/latency issue? It's not clear from the discussion if that is a common factor between all the incidents reported or if the issue is triggered by anything that causes timing to fall into a specific pattern.
@avoidik interesting, what made you think that raft protocol v2 would help? I'd need to look into the specific differences to be sure but it's not obvious to me that that might be a factor.
can we somehow increase timeouts to deal with this issue?
Increasing that _might_ reduce the frequency somewhat but fundamentally the autopilot health checks should not cause a cluster to be unable to re-elect a new leader even if they fail every time. I think you would need to set it like {"server_health_interval": "10s"} but I've not tested that.
banks
on 14 May 2018
Hey we just had an outage on a 0.8.3 cluster... I was organized enough to have gathered the goroutine and thread dumps from each machine this time. Is there somewhere / someone I can send these to on a more private channel?
nickwales
on 10 Jul 2018
@nickwales if you are comfortable sending them to [email protected] I'll get it to the right place. Thanks for doing that.
 pearkes
on 10 Jul 2018
pearkes
on 10 Jul 2018
We're experiencing a similar issue. Don't have a goroutine thread dump, but I do have a syslog output. We are on 0.8.3
 NikolaeVarius
on 5 Dec 2018
NikolaeVarius
on 5 Dec 2018
While we don't have any more direct news on this. We recently found https://github.com/hashicorp/consul/issues/5047 which could explain the failure for the leader to step down.
That issue is to do with a bug where establishLeadership which is called when a node first becomes a leader may fail and if it does so currently the leader remains in the leader loop so it doesn't step down and allow an election but it's not fully setup either.
The unknown link with this issue that would be the clincher that it's the same root cause would be if we can figure out a way that high diskIO could be a cause for something in establishLeadership to fail. It's not obvious to me what exactly that would look like yet, but we should keep in mind that it could be that the diskIO is a symptom of generally high load or some other situation that might also cause the failure mode.
I've not had time to look back through logs gathered here yet to see if there are signs that the establishLeadership bug is taking effect.
banks
on 7 Dec 2018
👋 we just had this problem (one cluster node slowly leaking fds, ending up with a non-working cluster due to hitting open fd limits and crashing) with consul-v0.9.3 [both clients/servers].
I'm a bit confused about where we are at in terms of what fixed and what is remaining due to conflicting comments (as in 1.0.2 is not showing the problem vs having the issue with 1.0.2 as well)
It would be really great if you could provide a status update if you have one!
Also please let me know if logs or some more info regarding our issue would help ⭐️
 caglar10ur
on 1 Jun 2019
caglar10ur
on 1 Jun 2019
@caglar10ur our best guess is that the leadership hanging state is a result of https://github.com/hashicorp/consul/issues/5047 the difficult underlying changes to raft to make that possible are now done so we hope to have the fix in the next release.
The hope is that we'll not see any more instances of this issue once that is merged but since we have never been able to reproduce/establish a certain root cause it's hard to say for certain!
banks
on 3 Jun 2019
@caglar10ur thanks for bearing with us. #5247 is merged and is going to be released in the next release. This fixes a problem we had in consul that could've caused your issue.
I will ping this thread once we have a release which you could play around with.
 i0rek
on 19 Jun 2019
i0rek
on 19 Jun 2019
@i0rek great. I'll keep my eyes on here and test once you release a new version. Thanks!
caglar10ur
on 20 Jun 2019
@caglar10ur 1.5.2 has been released and includes a possible fix.
i0rek
on 2 Jul 2019
@i0rek will try and let you know ASAP. Thanks again 🥇
caglar10ur
on 2 Jul 2019
Just letting you know that we haven't forgotten this. We are slowly upgrading clusters and observing their behaviors for a while before moving on to another cluster - so far so good. I'll keep you updated with our progress.
caglar10ur
on 31 Jul 2019
Much appreciated!
i0rek
on 31 Jul 2019
Completed migrating 10 clusters with various number of agents/servers from 0.9.2 to 1.5.2. We normally got hit by this issue in every other week so I still need to observe before declaring victory but please let me tell you this. This was one of the easiest migrations I ever did in my professional career. Even though I was migrating from an ancient version to the latest one nothing broke and everything worked as designed/excepted (I mean OK something was broken but it was just UI that is because it uses the new API calls to render now) - thank you so much for that ❤️ !
Will report back in couple of weeks...
caglar10ur
on 7 Aug 2019
I am glad to hear that everything went well for you!
i0rek
on 7 Aug 2019
Hey @caglar10ur
Just picking up on the mention of the UI here. I'm not sure if you have time to go into further detail on the UI issue you mention above. I'm half guessing it was just due to the rebuild of the UI we did a good few minor versions back (looking at the version jump you did you probably went from UI v1 to UI v2). I thought I'd quickly check in with you to double check, it sounds like the UI thing you mention above was a temporary thing and everything is fine now?
If you have time to give some more detail on the issue that'd be great, but don't worry if not. If there is something to look into I can start up another issue so I don't hijack this one.
Thanks!
 johncowen
on 7 Aug 2019
johncowen
on 7 Aug 2019
@johncowen ah sorry - I should have been more clear 🤦♂ - the UI partially worked during the upgrade and everything is fine now.
As far as I see Services section of the UI was only non-working piece while the cluster is in its mixed form where we have 0.9.2 and 1.5.2 servers. Once all servers are upgraded the UI started to render Services section as well without throwing 500 errors.
caglar10ur
on 9 Aug 2019
👋 just wanted to give an update as promised. Its been almost a month and things are looking really good on our end, both in terms of number of file descriptors and also stability of the clusters.
Thanks!
caglar10ur
on 6 Sep 2019
Great to hear that @caglar10ur! I will close this issue then. Thank you for your help!
i0rek
on 11 Sep 2019
Related issues
 sandstrom
·
3Comments
sandstrom
·
3Comments
 wargamez
·
4Comments
wargamez
·
4Comments
 satheeshCharles
·
3Comments
satheeshCharles
·
3Comments
 nicholasjackson
·
3Comments
nicholasjackson
·
3Comments
 achille-roussel
·
4Comments
achille-roussel
·
4Comments
Most helpful comment
Completed migrating 10 clusters with various number of agents/servers from 0.9.2 to 1.5.2. We normally got hit by this issue in every other week so I still need to observe before declaring victory but please let me tell you this. This was one of the easiest migrations I ever did in my professional career. Even though I was migrating from an ancient version to the latest one nothing broke and everything worked as designed/excepted (I mean OK something was broken but it was just UI that is because it uses the new API calls to render now) - thank you so much for that ❤️ !
Will report back in couple of weeks...