Concourse: GC issue? Seesaw pattern with containers and volumes after 3.4.1
Hi there!
Bug Report
After updating to 3.4.1 we are seeing the pattern below when it comes to containers and volumes (last 24h shown - saturday/sunday, so minimal activity, mostly just check containers running).
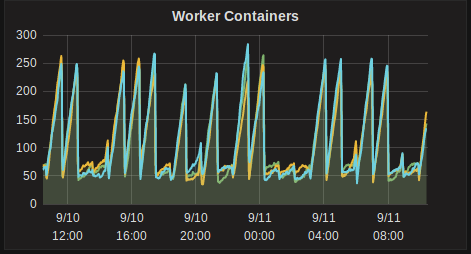
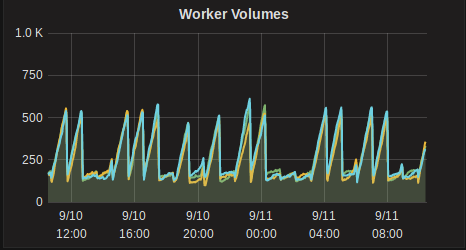
Before 3.4.1 we had around 80-100 containers and 200-250 volumes in a fairly flat line.
This definitely seems like there is something wrong going on however not really sure what I should go about debugging it.
I've tried resetting all workers but that doesn't fix it. By resetting I mean, retiring all workers, stop all workers once they've been retired, removing worker dirs, generated network interfaces and iptables rules and then restarting the workers.
There are a ton of these error log level messages for all 3 workers:
"source":"atc",
"message":"atc.container-collector.run.destroy-container.failed-to-destroy-garden-container",
"log_level":2,
"data":{
  "container":"47175361-18da-416d-7806-dd14053837ca",
  "error":"container already being destroyed"
  ...
}
This problem gets worse as more pipelines are added even if they are not doing work, which leads me to believe that the problem is associated with the lifecycle of check containers.
- Concourse version: 3.4.1
- Deployment type (BOSH/Docker/binary): binary
- Infrastructure/IaaS: Debian 8.9 (running kernel
4.9.30-2) - Did this used to work? Yes
 pn-santos
All 3 comments
Thanks for reporting this and giving us more information to work on in our ongoing investigation of this issue.
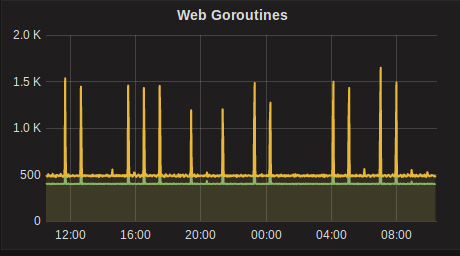
Interesting that those container spikes also coincide with Goroutine spikes, and the logs from the workers around containers already being destroyed is also interesting. We're looking into some similar issues on our larger deployment.
There's no clear issue that's causing this problem, but we're approaching this issue in a few directions right now:
- Optimizing DB queries; We found some tables needing indexes and some queries to optimize
- Collecting more metrics on what containers ( and volumes) are to-be-deleted, and how many are actually deleted (see #1573)
- Digging into the metrics we've added, and how they relate to the peaks of the sawtooth graph of Containers
 topherbullock
on 11 Sep 2017
topherbullock
on 11 Sep 2017
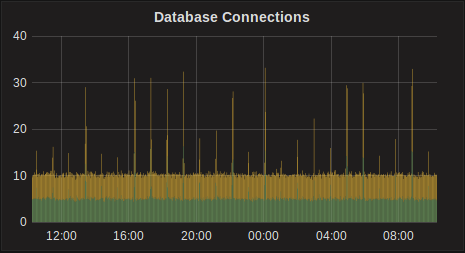
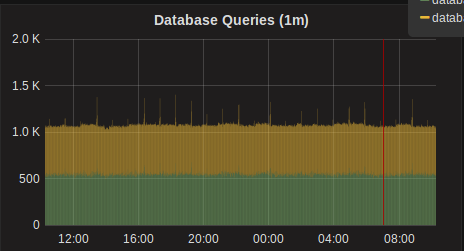
No problem, if you need any more info let me know (for now we'll keep running 3.4.1). I didn't post it but we also see spikes in db connections and a "small" increase in db queries (they don't exactly match the other spikes but could be related?)
pn-santos
on 12 Sep 2017
@pn-santos After investigating the issue in-depth, we've tracked down the root cause of these spikes. The issue is piling up resource check containers, specifically when 2 or more teams have identically configured resources. Basically the sessions associated with the resource check containers are not taking into account the team the resource is for, but later when we try and find an existing container we're looking for a container for the team.
topherbullock
on 13 Sep 2017
Related issues
 Lindsayauchin
·
3Comments
Lindsayauchin
·
3Comments
 clarafu
·
3Comments
clarafu
·
3Comments
 drahnr
·
3Comments
drahnr
·
3Comments
 danger-ranger
·
3Comments
danger-ranger
·
3Comments
 kcmannem
·
3Comments
kcmannem
·
3Comments
Most helpful comment
@pn-santos After investigating the issue in-depth, we've tracked down the root cause of these spikes. The issue is piling up resource check containers, specifically when 2 or more teams have identically configured resources. Basically the sessions associated with the resource check containers are not taking into account the team the resource is for, but later when we try and find an existing container we're looking for a container for the team.