Compodoc: [FEATURE] Allow zoom in graph
Overview of the issue
i use v1.0.0-beta.13
Motivation for or Use Case
In overview I ahve problem to read correctly graph at initial zoom and even when zoom maximum.
Initial zoom :
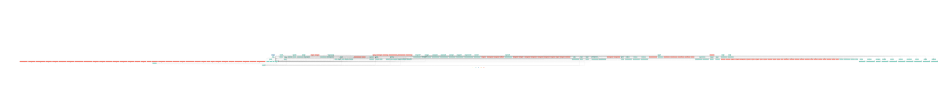
Max zoom:

Suggest a Fix
maybe allow all graph to zoom to infinite?
 elvisbegovic
All 14 comments
Perhaps in the future, you could consider implementing the dependency graph using an interactive scalable rendering using a library such as one of these:
- http://visjs.org/network_examples.html
- http://js.cytoscape.org/
- https://github.com/auchenberg/dependo
I believe there are a number of other tools that could be used that are not on this list as well.
 jaufgang
on 11 Aug 2017
jaufgang
on 11 Aug 2017
@jaufgang
Yes you are right. I use visjs for dom tree graph in component page.
I have done a little test for module graph, works fine but i have an issue with overlaping labels.
 vogloblinsky
on 13 Aug 2017
vogloblinsky
on 13 Aug 2017
Another point is that the modules with a large number of components have hard to read diagrams because all of the components are on the same row, so the diagram becomes extremely wide. A remedy for this could be to allow a maximum number of items on a row (maybe 8 or 10?), and then start adding new items on the next row below.
See http://visjs.org/examples/network/layout/hierarchicalLayoutUserdefined.html for an example where items 2, 10, 7 and 12 are all siblings but are on different rows.
I suppose the tricky bit there is keeping the arrow lines readable with a lot of items, but if that problem can be solved I think it look much better
Note that this suggestion might also improve the readability of the existing static images if you don't implement it using visjs.
jaufgang
on 15 Aug 2017
Just FYI, I've stumbled across another cool looking library that you might want to consider using as an alternate to visjs. perhaps it would avoid the overlapping labels issue
jaufgang
on 3 Nov 2017
@jaufgang which is ? 😃
vogloblinsky
on 3 Nov 2017
LOL! I'm sorry, I forgot to add the link.
jaufgang
on 3 Nov 2017
Crap, I'm sorry again. I just took a closer look and realized it's a commercial product that doesn't seem to have open source licensing. I wouldn't have posted this if I had noticed that earlier.
It does make cool looking graphs though.
jaufgang
on 3 Nov 2017
Oh yes i know it. Yes cool stuff, but not OSS. I think i will have a cool version with https://github.com/cpettitt/dagre-d3
vogloblinsky
on 3 Nov 2017
For more zooming, you can also increase the number of maxZoom allowed under the file ./js/svg-pan-zoom.controls.js
panZoom = svgPanZoom(document.getElementById('module-graph-svg').querySelector('svg'), {
zoomEnabled: true,
minZoom: 1,
maxZoom: 30
});
Hope it helps :)
 NicolasBehra
on 13 Dec 2017
NicolasBehra
on 13 Dec 2017
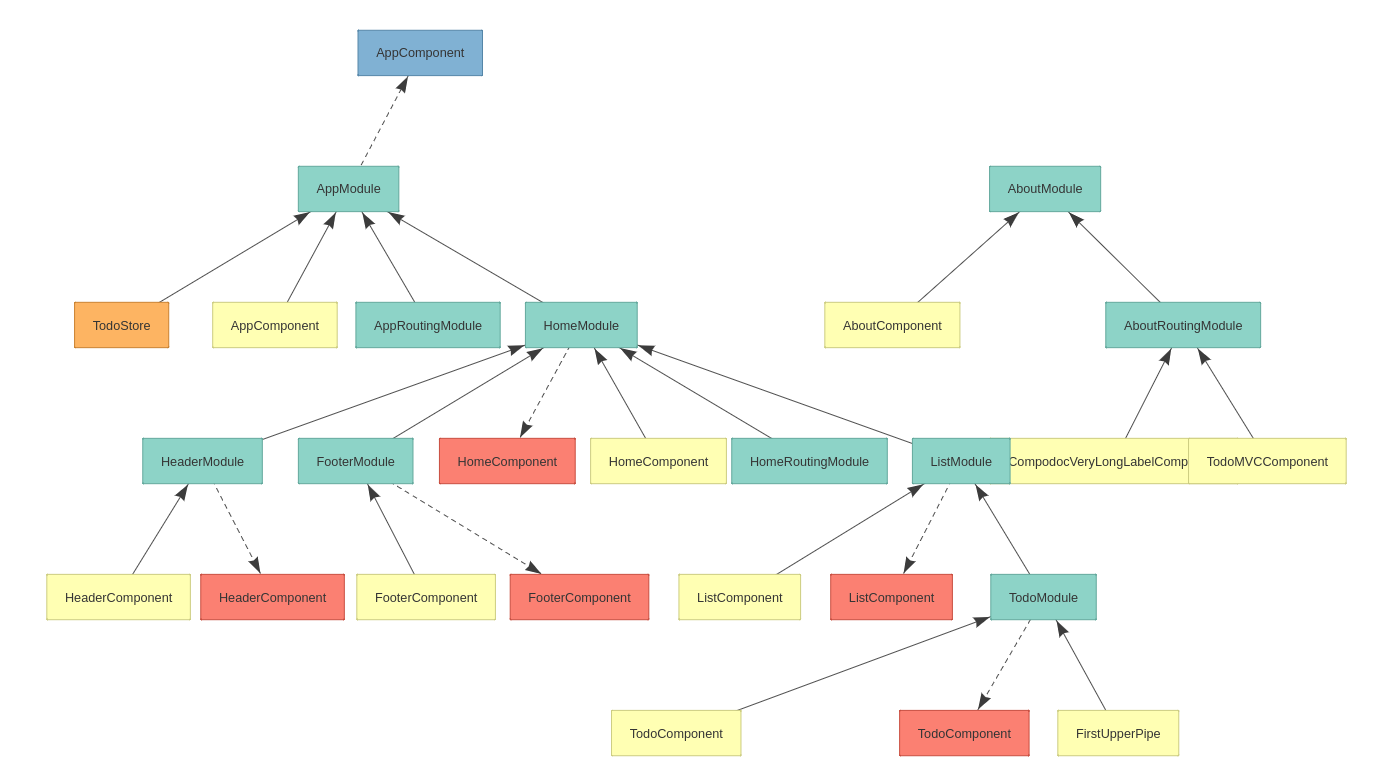
Last work on this topic could be seen in this screenshot.
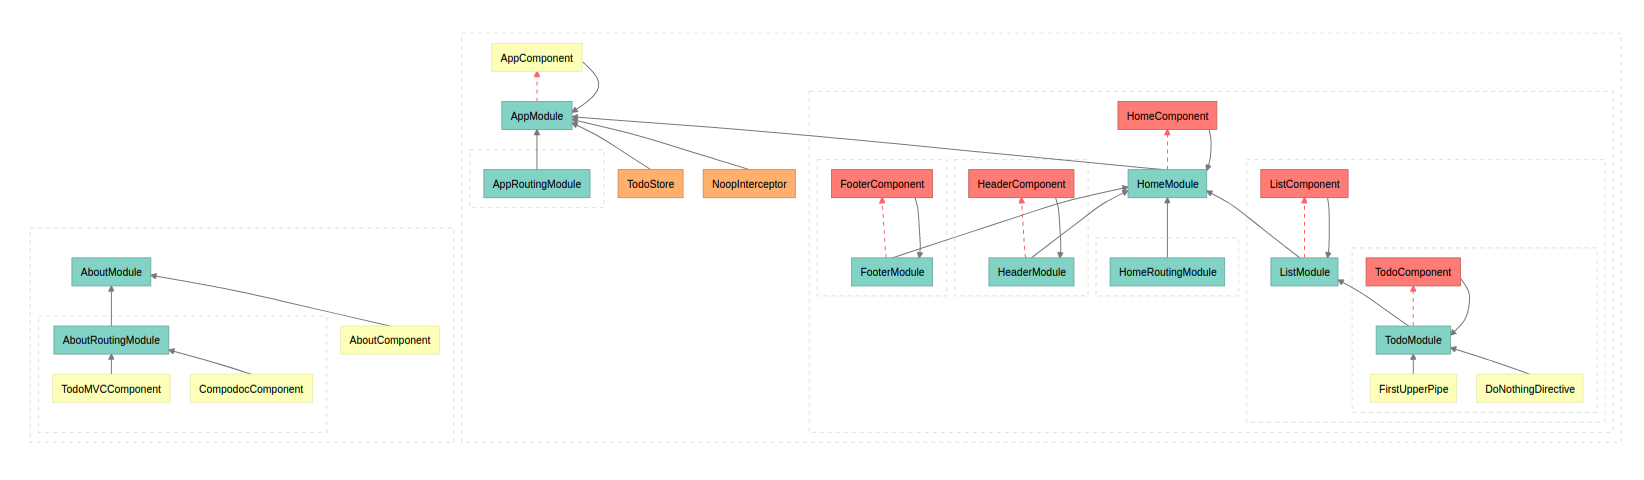
I have done a proof of concept with dagre-d3.
- works fine with long element label.
- graph is simpler because a component which is declarated and exported appears once, and not twice in the viz.js static graph rendering.
__before / viz.js__
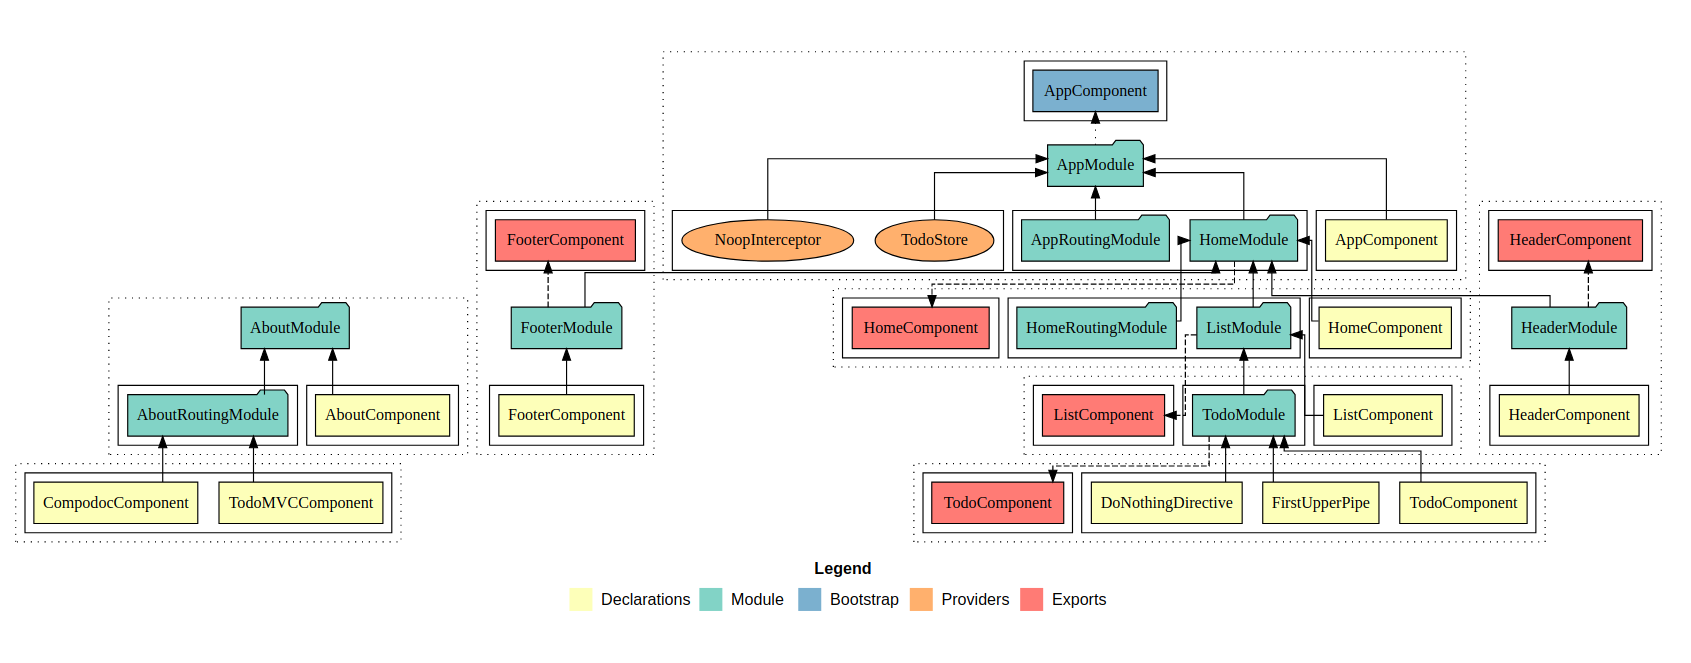
__future / dagre-d3__
vogloblinsky
on 22 Mar 2018
I appreciate that there's work happening on a new graphing engine, but given that it's been underway for a while, is there any way we could get some interim improvements to make the current graph a bit more usable? We're having the same zoom problem.
 mikejf-pr
on 13 Feb 2019
mikejf-pr
on 13 Feb 2019
This issue has been automatically marked as stale because it has not had recent activity. It will be closed if no further activity occurs. Thank you for your contributions.
![stale[bot] picture](https://avatars.githubusercontent.com/in/1724?v=4&s=40) stale[bot]
on 30 Sep 2019
stale[bot]
on 30 Sep 2019
This issue has been automatically closed because it has not had recent activity. Please file a new issue if you are encountering a similar or related problem. Thank you for your contributions.
stale[bot]
on 7 Oct 2019
This issue has been automatically locked due to inactivity. Please file a new issue if you are encountering a similar or related problem. Why locking ? Having issues with the most up-to-date context.
![lock[bot] picture](https://avatars.githubusercontent.com/in/6672?v=4&s=40) lock[bot]
on 6 Dec 2019
lock[bot]
on 6 Dec 2019
Related issues
 pborregg
·
38Comments
pborregg
·
38Comments
 jongunter
·
25Comments
jongunter
·
25Comments
 nikhilknoldus
·
18Comments
nikhilknoldus
·
18Comments
 ghost
·
17Comments
ghost
·
17Comments
 dharsanav
·
15Comments
dharsanav
·
15Comments
Most helpful comment
Last work on this topic could be seen in this screenshot.
I have done a proof of concept with dagre-d3.
__before / viz.js__

__future / dagre-d3__
