Cockroach: CockroachDB: Health checks time out under load
When a CockroachDB node is near 100% CPU usage, requests to any of the health check endpoints (/health, /health?ready=1 or /_admin/v1/health) will sometimes hang. In our example Kubernetes manifests, we have a timeout on our health checks of 1 second, but I have observed the endpoint fail to respond for 20+ seconds. The node is still otherwise up and able to process SQL queries.
This is a major problem when using an HTTP request to one of these endpoints as a Kubernetes liveness probe. When Kubernetes detects multiple liveness probes fail in a row, it believes that the CockroachDB container has crashed and will restart the container. This results downtime on a single-node cluster. On a three-node cluster, all three liveness probes can fail within a short period of time, also resulting in downtime.
Up until now, we have been using HTTP requests to the /health endpoint as our liveness probe. This is the behaviour specified within our example Kubernetes manifests.
To reproduce this behaviour, run cockroach workload init tpcc --warehouses=100 on a single-node GCP n1-standard-2 cluster (exact number of warehouses for a perfect repro TBD). On a Kubernetes cluster, our default liveness probe will fail, resulting in the CockroachDB container being restarted and the workload init command failing. If instead, you change the liveness probe to be a TCP check against either the HTTP or GRPC port, or remove the liveness probe entirely, the liveness probe will not fail and the workload init command will succeed. Outside of a Kubernetes environment, you can also reproduce this issue by repeatedly sending HTTP requests to a health check endpoint and measuring the response time.
Ideally, what we would like from CockroachDB are two health check endpoints:
One for use as the liveness probe, which always responds healthy unless the application needs to be restarted.
One for use as the readiness probe, which responds healthy if and only if that CRDB pod is able to receive requests. We currently use
/health?ready=1as our readiness probe endpoint. It will also time out under load, but that is less severe than a liveness probe timing out. Kubernetes will stop sending traffic directed to the CockroachDB service to any pod whose readiness probe is failing until the readiness probe recovers.
In the meantime, we have removed the liveness probes from our Kubernetes deployments of CockroachDB, which has helped keep CockroachDB running under load (Kubernetes will still restart the CockroachDB container if CockroachDB actually crashes). We should consider recommending this for other customers deploying CockroachDB on top of Kubernetes.
 DuskEagle
All 43 comments
cc @andy-kimball and @nvanbenschoten.
DuskEagle
on 6 Feb 2020
@DuskEagle, would the liveness probe typically need to do anything but just always return "healthy"? In other words, are there other conditions we might want to check beyond the implicit condition that the process is healthy enough to trivially respond to an HTTP request? It's hard to think of cases where the process is still up, and yet thinks things are so dire that we should kill the entire container.
+@tbg, since he's been thinking about liveness in rolling upgrade cases, which seems somewhat related. I'd like us to have very crisp definitions for each term, like "healthy" or "ready" or "available", etc.
 andy-kimball
on 6 Feb 2020
andy-kimball
on 6 Feb 2020
@andy-kimball CockroachDB has the node liveness heartbeat which causes an instance to shut down if the heartbeat times out. This is already performing much of the same function as a liveness probe is intended to. If the node liveness heartbeat didn't exist, I would see the value in the liveness probe. I'm struggling to think of a case where the liveness probe is all that useful given the node liveness heartbeat. I think removing the liveness probe makes sense given that.
In terms of definitions for terms, here is how terms are defined in Kubernetes:
Liveness: The container is running and is "healthy". If this is false, Kubernetes will restart the container. The definition of "healthy" is application-dependent, but an unhealthy container is in a state where a restart is required.
Readiness: The container is able to serve requests. If this is false, Kubernetes will remove the pod from the endpoints of all services that match the pod. In other words, traffic directed at the load balancer for the application will not be routed to this pod.
DuskEagle
on 7 Feb 2020
CockroachDB has the node liveness heartbeat which causes an instance to shut down if the heartbeat times out. This is already performing much of the same function as a liveness probe is intended to. If the node liveness heartbeat didn't exist, I would see the value in the liveness probe. I'm struggling to think of a case where the liveness probe is all that useful given the node liveness heartbeat. I think removing the liveness probe makes sense given that.
This is an interesting point re: node liveness! I think I agree with the conclusion (that CRDB implements a kind of liveness probe and that this means a k8s level liveness probe doesn't add value), though it makes me realize I don't understand node liveness as well as I want to. To fully agree with the conclusion, I want to understand it better.
Can someone explain more concretely what it means that "node liveness heartbeat which causes an instance to shut down if the heartbeat times out"? My understanding is that if a node's liveness record is not updated (via a write to a system range) then the REST of the cluster considers it down / it loses leases / etc. I didn't know that a node would crash itself if it starts failing to update its liveness record. This makes sense to me, though also I find it a bit confusing. Couldn't a node fail to update its liveness record NOT because it's having issues but instead because OTHER nodes are having issues? I'd expect that to be the case, since IIUC writing the liveness record is a KV level write and thus requires quorum?
This detail (from https://github.com/cockroachdb/docs/commit/a05437725c95dfa00922fec7716b33fca8563f57) also confuses me: "This is achieved using checks that ensure that each node connected to the cluster is updating its liveness record. This information is shared with the rest of the cluster using an internal gossip protocol." How does gossip come into play exactly?
 joshimhoff
on 7 Feb 2020
joshimhoff
on 7 Feb 2020
@andy-kimball CockroachDB has the node liveness heartbeat which causes an instance to shut down if the heartbeat times out. This is already performing much of the same function as a liveness probe is intended to. If the node liveness heartbeat didn't exist, I would see the value in the liveness probe. I'm struggling to think of a case where the liveness probe is all that useful given the node liveness heartbeat. I think removing the liveness probe makes sense given that.
I think there's some confusion here. A CRDB node does not kill itself for reasons related to its node liveness record. Nodes will continue running happily if they fail to heartbeat their record.
I came here because someone else is complaining about this issue. Joel, could you get some data for one of these humongous 20s latencies? I guess a CPU profile while that is going on, and also a go runtime trace, perhaps some extra logs around here.
I'd find it very curious if we straight up are not able to schedule a goroutine to serve that trivial request for 20s. Particularly since this request is coming on the HTTP port, not on the RPC port. So I wonder if we just have some unintended hidden contention somewhere in this request's path.
Since recently we've added authentication for this request, which might add some arbitrary latency (#45020), but I don't think that's the cause here.
 andreimatei
on 12 Feb 2020
andreimatei
on 12 Feb 2020
@andreimatei I've started looking into this to get better understanding of this behavior as well. I'll get the data you need.
 vladdy
on 12 Feb 2020
vladdy
on 12 Feb 2020
we're also having issues with that, please push this!
 christianhuening
on 13 Feb 2020
christianhuening
on 13 Feb 2020
I found the cause (see #45020) and will send a PR.
 knz
on 14 Feb 2020
knz
on 14 Feb 2020
Awesome! We'd appreciate a backport, as this is causing regular prod issues on CC clusters.
joshimhoff
on 14 Feb 2020
Hell yeah! We also need this fixed as soon as possible.
christianhuening
on 14 Feb 2020
understood.
knz
on 14 Feb 2020
Are you sure the authentication explains this? I think people are complaining about the /health endpoint, which did not do authentication, no?
andreimatei
on 14 Feb 2020
Are you sure the authentication explains this? I think people are complaining about the /health endpoint, which did not do authentication, no?
/_status/v1/details performs an authz check, which performs a KV lookup to system.users and/or system.role_members. Before #45119 gets merged, /health points to ...details and that would explain. With #45119 merged, /health becomes alias for /_admin/v1/health which does not require auth and thus becomes lightweight.
knz
on 14 Feb 2020
Sorry, I'm confused. I think I verified in https://github.com/cockroachdb/cockroach/issues/45018#issue-564127572 that /health does not currently perform authentication. It pretends to, but we take an early return path and run as root.
andreimatei
on 14 Feb 2020
I'm not talking about authentication. /health does not authenticate, as you've previously established, even though its target /_status/v1/details would otherwise.
The key point is that both /health and /_status/v1/details perform an authorization step. They retrieve the admin bit from system.users and system.role_members.
We want that for /_status/v1/details which is privileged, but we don't want it for /health. This is avoided by #45119.
knz
on 14 Feb 2020
FWIW in #45119 I have the following:
/healthwithout?ready=1returns OK as long as the process is running and the HTTP listener is active/health?ready=1will check liveness and health, and will return 503 in case of a problem, with the following details:node is waiting for cluster initializationwhen currently waiting oncockroach initnode is shutting downif currently drainingnode is not healthyif liveness not updated recently
Note that neither prior to this change nor with it, does /health?ready=1 check availability of ranges in KV. It relies on the liveness bit to reflect that a recent heartbeat (incl KV write) of the node descriptor has succeeded.
knz
on 14 Feb 2020
@vladdy @DuskEagle after discussion with Andrei, we still find it useful to extract a CPU profile when the health endpoint seems to have a high latency. Please provide this to us regardless of progress made on #45119 - thanks.
knz
on 14 Feb 2020
I'm a bit lost on what the latest on these timeout issues is (comments here indicate that it was solved, but we discussed it yesterday in KV weekly and it seemed mysterious still). A small recap would be nice. Either way, I just reviewed #45119 and it's how things ought to work. Don't restart the pod until /health fails (and this is just a noop request today), and determine whether to send client traffic to a node based on /health?ready=true.
There is no acceptable reason for /health to take 20+s unless perhaps the system is severely, severely overloaded. But then it should also not be possible to do anything else with the node in the meantime.
Going back a few messages to https://github.com/cockroachdb/cockroach/issues/44832#issuecomment-583144024 about the crisp definitions, they are problematic right now because we use the term "liveness" at different levels, all while basing it mostly on the NodeLiveness subsystem, which is too low-level in most cases but name-squats pretty effectively on the liveness concept. This is a bit unfortunate and we can change it over time, but as far as external communication goes, we should stick to the k8s verbiage in which a pod is "live" unless it's really horked up, but ready only when it should get served requests, which means (today) having a recent heartbeat on the liveness record and not being about to shut down (and in the future should include things like https://github.com/cockroachdb/cockroach/issues/44206). That's also the status quo after #45119, so externally we should be good (assuming the docs reflect that).
I commented on some of the internal confusion more concretely in
https://github.com/cockroachdb/cockroach/issues/45123#issuecomment-588246392.
 tbg
on 19 Feb 2020
tbg
on 19 Feb 2020
There is no acceptable reason for /health to take 20+s unless perhaps the system is severely, severely overloaded. But then it should also not be possible to do anything else with the node in the meantime.
I think we certainly need to dig deeper into root cause, but on cloud, we are seeing liveness probe failures when a node is overloaded. Out of CPU, nearly out of memory. Often a customer is doing functional testing and is hitting CRDB hard on purpose as a stress test. Not sure if this is what you imagine when you say "severely, severely overloaded", but I guess Joel's repro instructions at the top of this issue can make concrete how overloaded CRDB is when liveness probes start failing.
I think it's a better experience for users if when CRDB is out of resources, serving requests starts taking more time but doesn't lead to total unavailability due to k8s killing the pods.
joshimhoff
on 19 Feb 2020
I have discussed this with @DuskEagle yesterday. Here's the summary of our conversation:
- what tobias said about the difference between
/healthand/health?ready=1(this was already largely known) - agreement/acknowledgement that
/health, being served by a Goroutine in a cooperatively scheduled system, can suffer from arbitrary delays when the system is overloaded. This is a "feature" of the Go runtime. - From @DuskEagle we need a probe that ascertains the process is still running, albeit overloaded. A probe that can suffer arbitrary delays just because the process is slow "doesn't match the requirement".
- agreement/acknowledgement that asking the system being monitored to report on its liveness (not readiness!) is conceptually flawed
Conclusion: proposal to decide liveness based on another metric that can be sampled "outside" of the process without suffering from the vagaries of the go scheduler:
- check that the process is still running (k8s does this)
- check that it has performed disk I/O recently (an idle node still performs disk i/o for logging every 1-10 second IIRC)
- perhaps other OS-level checks that we can determine together
knz
on 19 Feb 2020
I'm a bit lost on what the latest on these timeout issues is (comments here indicate that it was solved, but we discussed it yesterday in KV weekly and it seemed mysterious still). A small recap would be nice.
The recap is that we're at square one - no idea why this endpoint is not responding for "20+ seconds".
agreement/acknowledgement that /health, being served by a Goroutine in a cooperatively scheduled system, can suffer from arbitrary delays when the system is overloaded. This is a "feature" of the Go runtime.
Conclusion: proposal to decide liveness based on another metric that can be sampled "outside" of the process without suffering from the vagaries of the go scheduler:
Well, hold up one second :). Let's not give up quite that easy. Although in theory one can create arbitrary-length run queues, I don't think we've really seen that yet in CRDB, particularly not across requests coming on different sockets. Case in point: when we moved the liveness heartbeats on a different gRPC connection, they became a lot more reliable under heavy load - basically I don't think we can get them to take over a few secs any more regardless of CPU load (different story for IO contention, but that's not the case for these probes).
These health checks are already on a different connection from something else, so you'd think that helps them cut some lines. Except maybe it's the fact that a new TLS connection is established every time that kills them. I've tried to see if Kubernetes can be configured to reuse a connection, and I couldn't see how. I think we should try removing the TLS from the equation and seeing if that helps. If it doesn't, let's run experiments with reusing connections manually.
And generally let's at least look at some runtime traces before declaring defeat.
@DuskEagle and @joshimhoff , do you mind playing with this some more?
A thing that we've seen is pathological behavior when the GOMAXPROCS is not configured correctly. That's not the case for CC, is it?
The CC nodes we're talking about have at least a few CPUs, right? And there's no swapping?
andreimatei
on 19 Feb 2020
Conclusion: proposal to decide liveness based on another metric that can be sampled "outside" of the process without suffering from the vagaries of the go scheduler
To flesh out this idea a bit more, we would be relying on a liveness command which runs in a separate process in the container. This command could be as simple as parsing the output of iostat, or could be something we bake into the Cockroach CLI itself (e.g. cockroach liveness).
I think we should try removing the TLS from the equation and seeing if that helps
That's interesting. I will try that and report back. I'll also capture some CPU profiles while I do so.
A thing that we've seen is pathological behavior when the GOMAXPROCS is not configured correctly. That's not the case for CC, is it?
We don't restrict the amount of CPU available to pods, but there is a discrepancy between the total amount of vCPUs available to pods and the total amount available on the node (Kubernetes reserves a fraction of the total CPU on the node). We don't set GOMAXPROCS explicitly right now in CC.
The CC nodes we're talking about have at least a few CPUs, right?
The nodes we have tested on are mostly 2 vCPU machines, which is the most common CC node size. I'm unsure if this occurs on larger instances right now.
And there's no swapping?
This condition occurs even when the nodes are not under memory pressure.
DuskEagle
on 19 Feb 2020
We don't restrict the amount of CPU available to pods, but there is a discrepancy between the total amount of vCPUs available to pods and the total amount available on the node (Kubernetes reserves a fraction of the total CPU on the node). We don't set GOMAXPROCS explicitly right now in CC.
So what does runtime.numcpu end up being on these 2vCPU nodes? We have it in one of the reports in a debug.zip.
I'm unsure if this occurs on larger instances right now.
I'd be curious to know.
andreimatei
on 19 Feb 2020
The recap is that we're at square one - no idea why this endpoint is not responding for "20+ seconds".
The point about TLS (and perhaps also the gw-runtime overhead) is reasonable.
@DuskEagle what do we need a liveness command for in the first place, if not being able to schedule a goroutine for 20+s is not guaranteed? What's an example of a situation in which you would like the liveness probe to fire? It seems to me that all we want to make sure is that the process is running, which is just to say that the pod is still there.
tbg
on 19 Feb 2020
We probably want the probe to detect deadlocks and unresolved disk stalls. Hence my interest for iops.
Verstuurd vanaf mijn Android apparaat met K-9 Mail. Excuseer mijn beknoptheid.
knz
on 19 Feb 2020
What kind of deadlock can we possibly detect? A deadlock of the complete runtime (i.e. a Go bug) seems reasonable to detect, but as long as we have Rocks there will always be some moving parts. Stalled disks -- are they really a signal to restart the pod? We have the mechanisms internally to detect them, but disabled them due to false positives (for some value of false, we should revisit that now that the AddSST-induced problems are a bit more under control). The disks are (on cloud) usually not related to the pod much. It seems reasonable to have no liveness probe, but that's not my turf.
Either way, what I'm taking away from this issue (assuming it's corroborated) is that we may want to look into serving /health up in as cheap a way as possible, so that it can serve as a "reasonable" liveness probe for those that want it.
tbg
on 19 Feb 2020
What's an example of a situation in which you would like the liveness probe to fire?
I don't know if there are any common cases. But say, if the GRPC server was closed erroneously, that would be nice to detect and restart the process.
I think no liveness probes is a reasonable enough position from a practical perspective, but I think ideally, we would be able to have a liveness probe to protect ourselves from bugs in CRDB that cause the process to enter a bad state.
DuskEagle
on 19 Feb 2020
I think no liveness probes is a reasonable enough position from a practical perspective, but I think ideally, we would be able to have a liveness probe to protect ourselves from bugs in CRDB that cause the process to enter a bad state.
Right, but under the condition that the probe is green even under severe overload, this seems difficult to achieve.
Also, in such an anomalous condition (say some pervasive deadlock), I as a KV member would hope that we take the node out of load balancing (i.e. detect the problem in Ready()) so that we can look at it while it's still happening.
tbg
on 19 Feb 2020
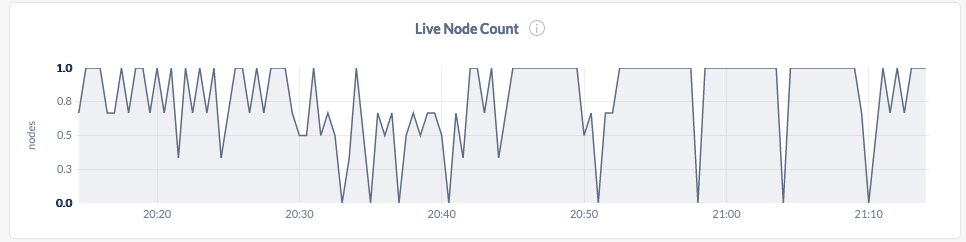
I ran some tests on a v19.2.4 2vCPU node today, and recorded the top response times to the /health endpoint:
time (UTC) | health check latency (s)
20:40:53   4.743591
20:27:12   5.021611
21:29:14   5.099199
20:49:54   5.414647
20:57:34   6.233956
20:58:16   6.404779
21:17:27   18.492658
21:15:16   21.250652
21:18:56   21.714699
21:32:57   38.244180
21:25:54   39.400842
21:27:08   42.366322
21:36:43   44.206908
21:32:01   44.718882
I was generating CPU profiles every five seconds throughout the test, and took a look through all of the CPU profiles that aligned with high health check response times. I wasn't able to pick up anything interesting from looking through them, but I've attached them here: pprof.tar.gz
I wasn't generating goroutine dumps during this test; I can try and get those later.
The live node count seems to flap a fair bit while running this, although the process never actually died:
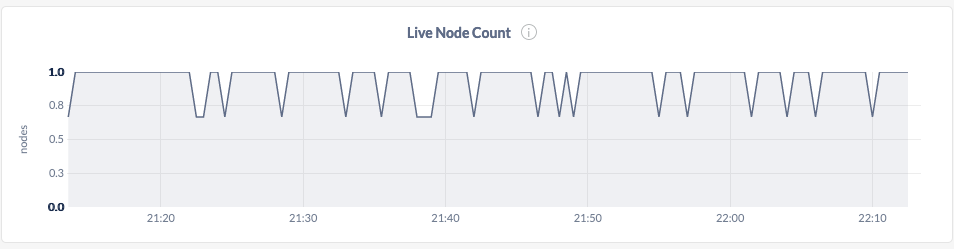
@andrei's theory about TLS being a culprit seems to hold a lot of water. I simultaneously ran the same test on a v19.2.4 cluster running in insecure mode, and observed much better maximum response times and less live node flappiness:
time (UTC) | health check latency (s)
21:33:39   2.528204
21:42:56   2.545731
21:44:50   2.557551
21:21:47   2.589759
21:01:08   2.604588
21:26:57   2.656428
21:39:39   2.664069
20:46:49   2.683684
21:10:51   2.925277
21:07:03   3.401730
DuskEagle
on 19 Feb 2020
Interesting about TLS. I'd try maintaining an open connection too and see if that drives the latencies down further.
Rather than CPU profiles, I'd more interested in getting the timing of network connections being accepted and of the details endpoint running. I'd put some new logging statements. Or better yet, insert tracepoints into a go runtime trace (but I'm not well versed in how to do that).
andreimatei
on 19 Feb 2020
@DuskEagle I cobbled together some code that might help you. It opens a bare-bones http server on :8081 and a loop that every 5s, starts a runtime trace, hits that endpoint, and stops the trace (they get put in the log dir, format is trace_<timestamp-trace-started>_<duration_of_http_req>).
You can replace the bare-bones http call with one that hits the real endpoint to get a runtime trace that captures the TLS/grpc overhead. My hope here is that you'll find that this bare-bone endpoint is much more responsive in overloaded systems.
diff --git a/pkg/cli/start.go b/pkg/cli/start.go
index e20b20f7fb..27c9841fca 100644
--- a/pkg/cli/start.go
+++ b/pkg/cli/start.go
@@ -18,12 +18,14 @@ import (
    "io"
    "io/ioutil"
    "net"
+   "net/http"
    "net/url"
    "os"
    "os/signal"
    "path/filepath"
    "runtime"
    "runtime/pprof"
+   "runtime/trace"
    "strings"
    "text/tabwriter"
    "time"
@@ -820,6 +822,39 @@ If problems persist, please see ` + base.DocsURL("cluster-setup-troubleshooting.
                fmt.Print(msg)
            }

+           go func() {
+               f := func(http.ResponseWriter, *http.Request) {}
+               log.Fatal(context.Background(), http.ListenAndServe(":8081", http.HandlerFunc(f)))
+           }()
+
+           go func() {
+               dir := startCtx.logDir.String()
+               t := time.NewTicker(5 * time.Second)
+               for {
+                   <-t.C
+                   name := filepath.Join(dir, "trace_"+timeutil.Now().Format(time.RFC3339))
+                   f, err := os.Create(name)
+                   if err != nil {
+                       panic(err)
+                   }
+                   if err := trace.Start(f); err != nil {
+                       panic(err)
+                   }
+                   tBegin := timeutil.Now()
+                   if _, err := http.Get("http://127.0.0.1:8081"); err != nil {
+                       panic(err)
+                   }
+                   dur := timeutil.Since(tBegin)
+                   trace.Stop()
+                   if err := f.Close(); err != nil {
+                       panic(f)
+                   }
+                   _ = os.Rename(name, fmt.Sprintf("%s_%.2fs", name, dur.Seconds()))
+               }
+           }()
+
            return nil
        }(); err != nil {
            errChan <- err
I'd also be curious what happens if we configure Kubernetes with a TCP liveness probe instead of the HTTP one.
Also, yesterday I was suggesting we simply get rid of the timeout on this probe. But now I'm thinking more radically (along similar lines with previous discussion in this thread) why exactly do we even use a liveness probe in Kubernetes? Kubernetes already acts as a baby sitter for the process even without the probe. The only thing the probe gives us, I guess, is proof that the UI port was opened immediately after start. I don't think I've ever seen it not open, so I question the value of the check. I'd rather rely on other alerting to catch such situations.
I think I'd just get rid of it.
andreimatei
on 20 Feb 2020
I'd also be curious what happens if we configure Kubernetes with a TCP liveness probe instead of the HTTP one.
In this case, the liveness probes do not fail under load. We do generate some log spam when using them (#32102), but that's a separate, minor issue.
The only thing the probe gives us, I guess, is proof that the UI port was opened immediately after start... I think I'd just get rid of it.
The probe could potentially help us catch deadlocks within the process. I don't think the probe provides a lot of value, but I think a well-designed probe does provide non-zero value. But currently, I think no probe > the probe we've been using.
DuskEagle
on 20 Feb 2020
The probe could potentially help us catch deadlocks within the process. I don't think the probe provides a lot of value, but I think a well-designed probe does provide non-zero value. But currently, I think no probe > the probe we've been using.
Reiterating my points from above (just in case they got lost), under the constraints of working on overloaded systems, it seems unlikely we will ever be able to do this in the liveness probe. Plus I'd hope we put it in the readyness probe anyway for debugging.
tbg
on 20 Feb 2020
The deadlock thing I don't buy. What kind of deadlock is better detected outside of CRDB? If we were able to detect deadlocks, we'd be doing it inside Cockroach and crash ourselves.
I think no probe > the probe we've been using
So do you want to take them out of the k8s configs we're publishing?
andreimatei
on 20 Feb 2020
You can replace the bare-bones http call with one that hits the real endpoint to get a runtime trace that captures the TLS/grpc overhead. My hope here is that you'll find that this bare-bone endpoint is much more responsive in overloaded systems.
Indeed it is. Under the same load as before, this endpoint responded in 0.4s on average and never took longer than 1.5s. I've attached the slowest traces: traces.tar.gz
So do you want to take [the liveness probes] out of the k8s configs we're publishing?
I think we're mostly in agreement that this is the right action to take, so I can do that.
DuskEagle
on 21 Feb 2020
Agreed that removing the liveness probe from the k8s configs is best thing to do. We have no evidence that it has given benefits and plenty of evidence that it has been detrimental to stability.
andy-kimball
on 21 Feb 2020
Actually, let me to disagree with the removal. Failing liveness probe started this discussion, which already resulted in significant findings in my opinion:
- Node liveness record is different from node liveness definition.
- Probes should not go through TLS and have any other kind of authentication/authorization to make them lightweight.
- It is possible to use the probe to detect other things about unhealthy environment such as disk stalls. It makes sense to keep that in mind since not everybody runs the db with any kind of cloud storage. Why this is a reasonable way to run the checks instead of doing them inside the code is that you get a separate process that could send your process TERM and eventually KILL signal on health probe failure. This is usually supported not only in k8s, but in other process supervisors as well.
Finally, I would still argue that a service running at 100% of CPU for prolonged amount of time is already broken service as even if it is assumed that all queries to it get eventually processed under such condition their execution time would already break any kind of SLA. Sooner or later we will need to make the readiness probe to fail at high CPU usage and without liveness probe we will be flying blind if it gets removed. It is possible to use the readiness probe as liveness indicator in some cases, but still it is main purpose is for the load balancers and not for the process supervisors.
vladdy
on 21 Feb 2020
Load balancers need a readiness probe not liveness. Our readiness probe is pretty all right and hasn't been affected in this discussion.
Verstuurd vanaf mijn Android apparaat met K-9 Mail. Excuseer mijn beknoptheid.
knz
on 22 Feb 2020
I'm seeing this in the field as well with several K8s partner deployments, and I understand @holtrdan ran into this as well. @nstewart this is one of the k8s related issues I was referring to on our call yesterday.
 keith-mcclellan
on 5 Mar 2020
keith-mcclellan
on 5 Mar 2020
CockroachDB has the node liveness heartbeat which causes an instance to shut down if the heartbeat times out. This is already performing much of the same function as a liveness probe is intended to. If the node liveness heartbeat didn't exist, I would see the value in the liveness probe. I'm struggling to think of a case where the liveness probe is all that useful given the node liveness heartbeat. I think removing the liveness probe makes sense given that.
This is an interesting point re: node liveness! I think I agree with the conclusion (that CRDB implements a kind of liveness probe and that this means a k8s level liveness probe doesn't add value), though it makes me realize I don't understand node liveness as well as I want to. To fully agree with the conclusion, I want to understand it better.
Can someone explain more concretely what it means that "node liveness heartbeat which causes an instance to shut down if the heartbeat times out"? My understanding is that if a node's liveness record is not updated (via a write to a system range) then the REST of the cluster considers it down / it loses leases / etc. I didn't know that a node would crash itself if it starts failing to update its liveness record. This makes sense to me, though also I find it a bit confusing. Couldn't a node fail to update its liveness record NOT because it's having issues but instead because OTHER nodes are having issues? I'd expect that to be the case, since IIUC writing the liveness record is a KV level write and thus requires quorum?
This detail (from cockroachdb/docs@a054377) also confuses me: "This is achieved using checks that ensure that each node connected to the cluster is updating its liveness record. This information is shared with the rest of the cluster using an internal gossip protocol." How does gossip come into play exactly?
45929
 yangxuanjia
on 11 Mar 2020
yangxuanjia
on 11 Mar 2020
@yangxuanjia the issue you linked does not seem related to this discussion in any way.
knz
on 11 Mar 2020
Discussed with @vladdy today:
1) it's practically ok for CC to say "liveness = process liveness"
2) however it would be better if also offered a working liveness probe over HTTP
3) it's OK if the liveness probe takes multiple seconds to respond under heavy CPU load - we should calibrate and then provide some guidance
4) to minimize the impact of CPU usage we should change the liveness probe to be HTTP only (no TLS)
I am filing a separate issue #48069 to do this last point - ensure that our HTTP endpoint is able to process _some_ API calls (those that are unauthenticated, including liveness) over HTTP without TLS. Once that is done, I'll close this issue.
knz
on 27 Apr 2020
Related issues
 benesch
·
140Comments
benesch
·
140Comments
 gigatexal
·
30Comments
gigatexal
·
30Comments
 danhhz
·
55Comments
danhhz
·
55Comments
 cockroach-teamcity
·
30Comments
cockroach-teamcity
·
41Comments
cockroach-teamcity
·
30Comments
cockroach-teamcity
·
41Comments
Most helpful comment
@andreimatei I've started looking into this to get better understanding of this behavior as well. I'll get the data you need.