Cockroach: opt: Create statistics jobs taking too long
Describe the problem
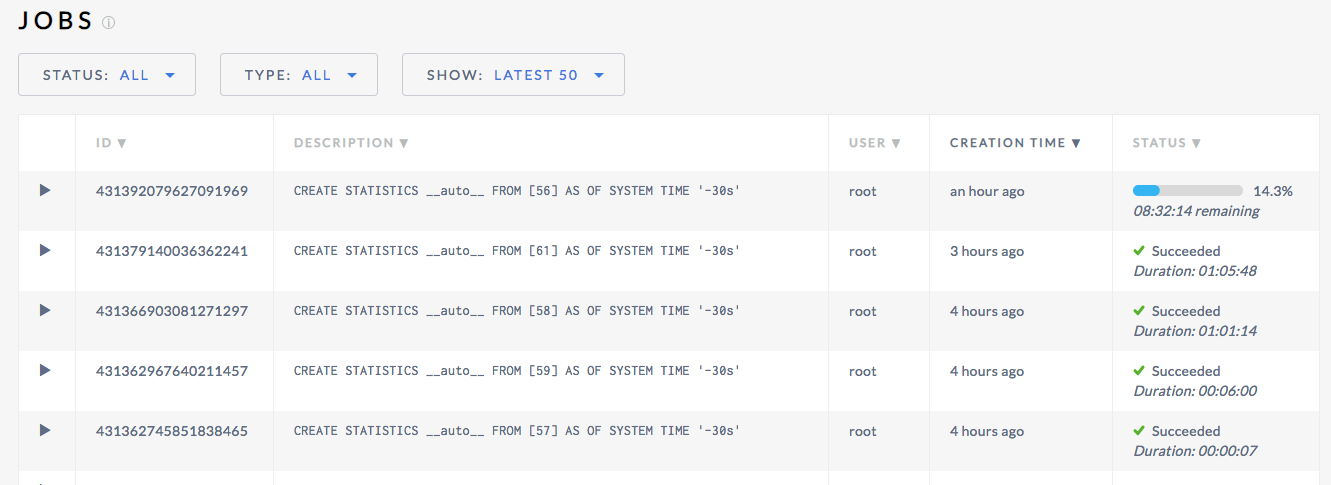
Stats look hung in the webui:
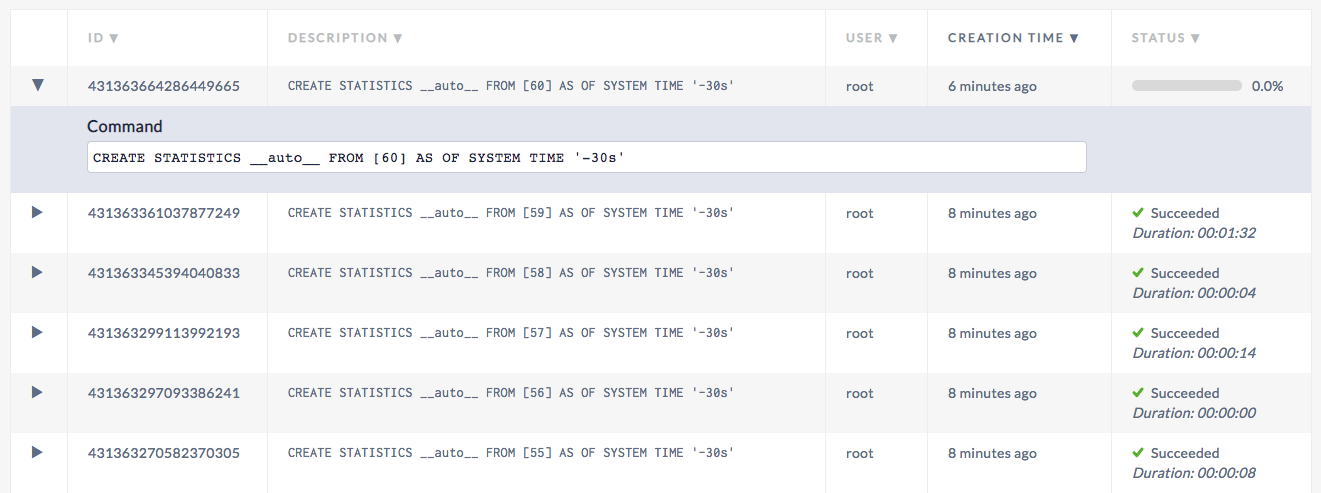
Show Jobs
root@localhost:26257/defaultdb> show jobs;
        job_id       |   job_type   |                                                 description                                                  | user_name |  status   | running_status |             created              |             started              |             finished             |             modified             | fraction_completed | error | coordinator_id
+--------------------+--------------+--------------------------------------------------------------------------------------------------------------+-----------+-----------+----------------+----------------------------------+----------------------------------+----------------------------------+----------------------------------+--------------------+-------+----------------+
  431363664286449665 | CREATE STATS | CREATE STATISTICS __auto__ FROM [60] AS OF SYSTEM TIME '-30s'                                                | root      | running   | NULL           | 2019-03-04 15:09:03.251493+00:00 | 2019-03-04 15:09:03.255912+00:00 | NULL                             | 2019-03-04 15:18:57.213032+00:00 |                  0 |       |              1
  431363361037877249 | CREATE STATS | CREATE STATISTICS __auto__ FROM [59] AS OF SYSTEM TIME '-30s'                                                | root      | succeeded | NULL           | 2019-03-04 15:07:30.707371+00:00 | 2019-03-04 15:07:30.712102+00:00 | 2019-03-04 15:09:03.24189+00:00  | 2019-03-04 15:09:03.24189+00:00  |                  1 |       |              1
  431363345394040833 | CREATE STATS | CREATE STATISTICS __auto__ FROM [58] AS OF SYSTEM TIME '-30s'                                                | root      | succeeded | NULL           | 2019-03-04 15:07:25.933245+00:00 | 2019-03-04 15:07:25.937884+00:00 | 2019-03-04 15:07:30.697574+00:00 | 2019-03-04 15:07:30.697575+00:00 |                  1 |       |              1
  431363299113992193 | CREATE STATS | CREATE STATISTICS __auto__ FROM [57] AS OF SYSTEM TIME '-30s'                                                | root      | succeeded | NULL           | 2019-03-04 15:07:11.809693+00:00 | 2019-03-04 15:07:11.814122+00:00 | 2019-03-04 15:07:25.923187+00:00 | 2019-03-04 15:07:25.923188+00:00 |                  1 |       |              1
  431363297093386241 | CREATE STATS | CREATE STATISTICS __auto__ FROM [56] AS OF SYSTEM TIME '-30s'                                                | root      | succeeded | NULL           | 2019-03-04 15:07:11.193052+00:00 | 2019-03-04 15:07:11.197848+00:00 | 2019-03-04 15:07:11.799813+00:00 | 2019-03-04 15:07:11.799814+00:00 |                  1 |       |              1
  431363270582370305 | CREATE STATS | CREATE STATISTICS __auto__ FROM [55] AS OF SYSTEM TIME '-30s'                                                | root      | succeeded | NULL           | 2019-03-04 15:07:03.102537+00:00 | 2019-03-04 15:07:03.10715+00:00  | 2019-03-04 15:07:11.18345+00:00  | 2019-03-04 15:07:11.183451+00:00 |                  1 |       |              1
  431362431262982145 | RESTORE      | RESTORE TABLE tpch.* FROM 'gs://cockroach-fixtures/workload/tpch/scalefactor=1/backup' WITH into_db = 'tpch' | root      | succeeded | NULL           | 2019-03-04 15:02:46.962591+00:00 | 2019-03-04 15:02:46.968325+00:00 | 2019-03-04 15:05:57.58245+00:00  | 2019-03-04 15:05:57.582451+00:00 |                  1 |       |              1
(7 rows)

Time: 3.328167ms
To Reproduce
Setup SQL 20 and compelted the initial restore. Did not run any load.
Expected behavior
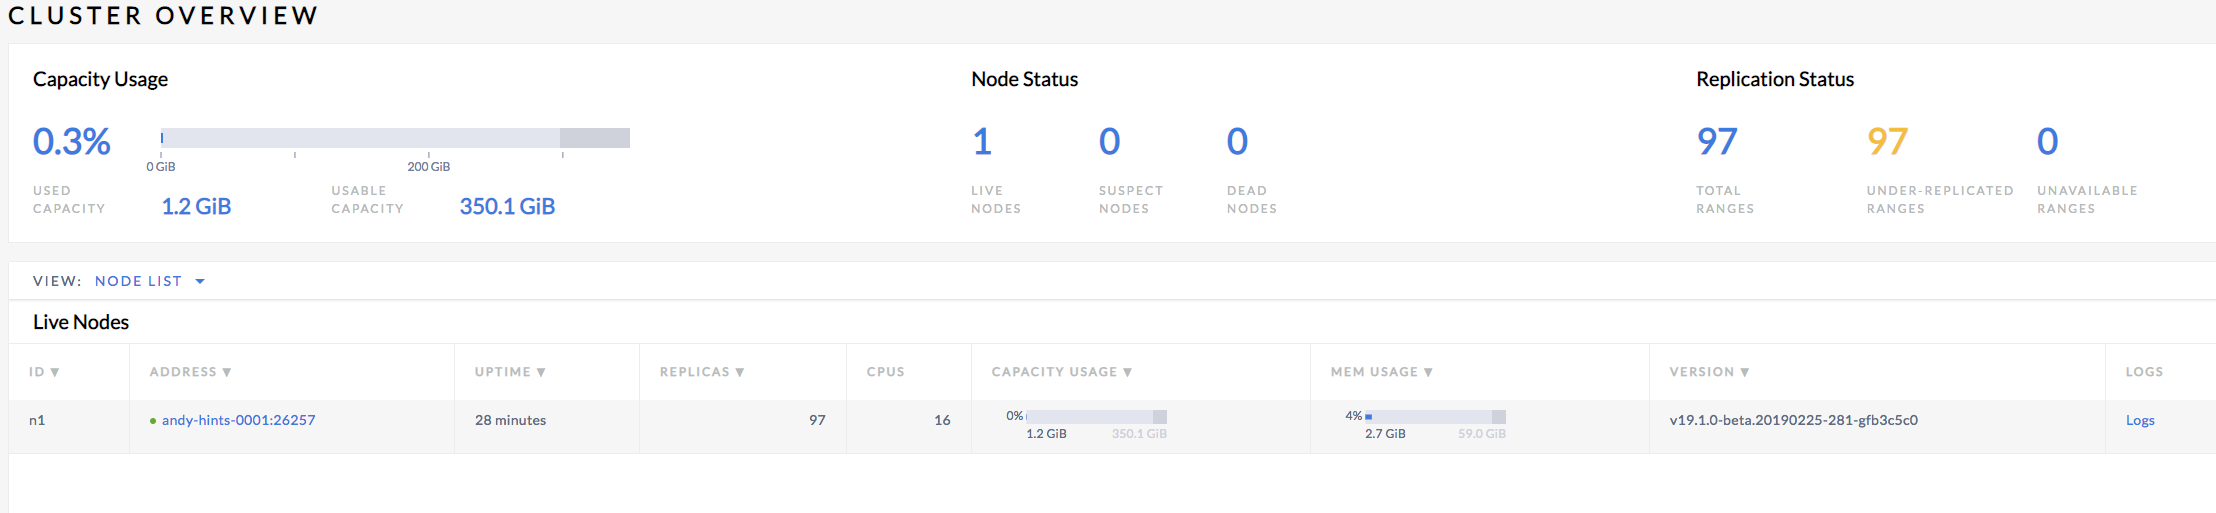
Progress to be made on the job and the job to have already completed. The cluster is small so this should be a fast job:
Environment:
v19.1.0-beta.20190225-281-gfb3c5c0
 awoods187
All 25 comments
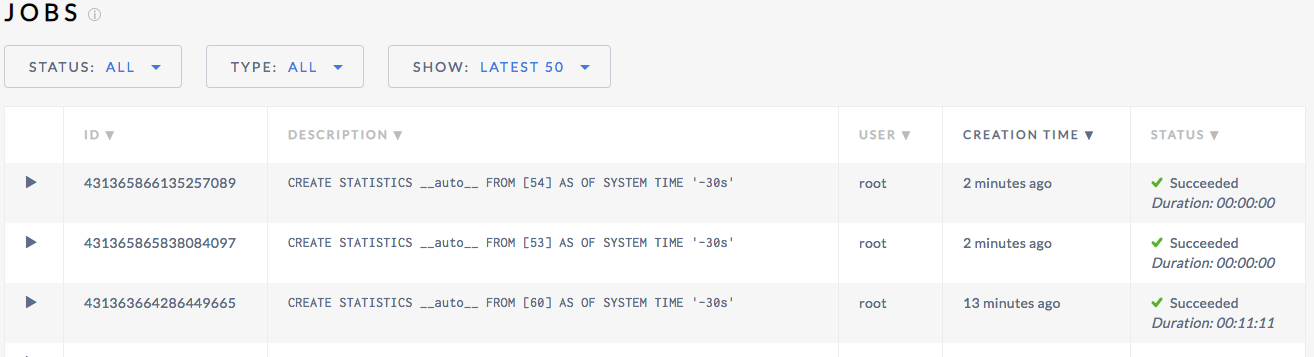
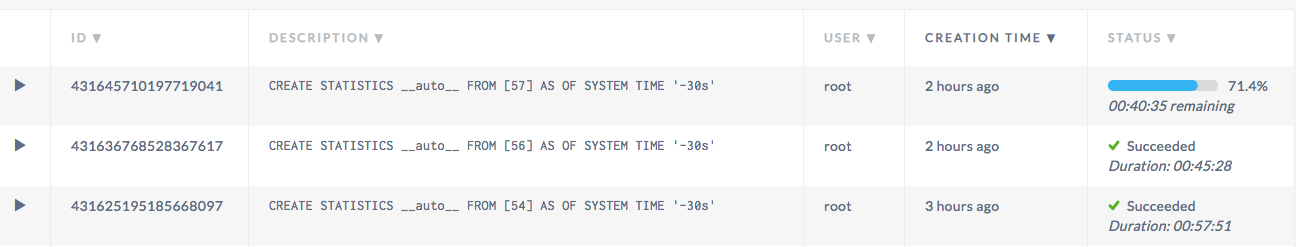
The job eventually completes:
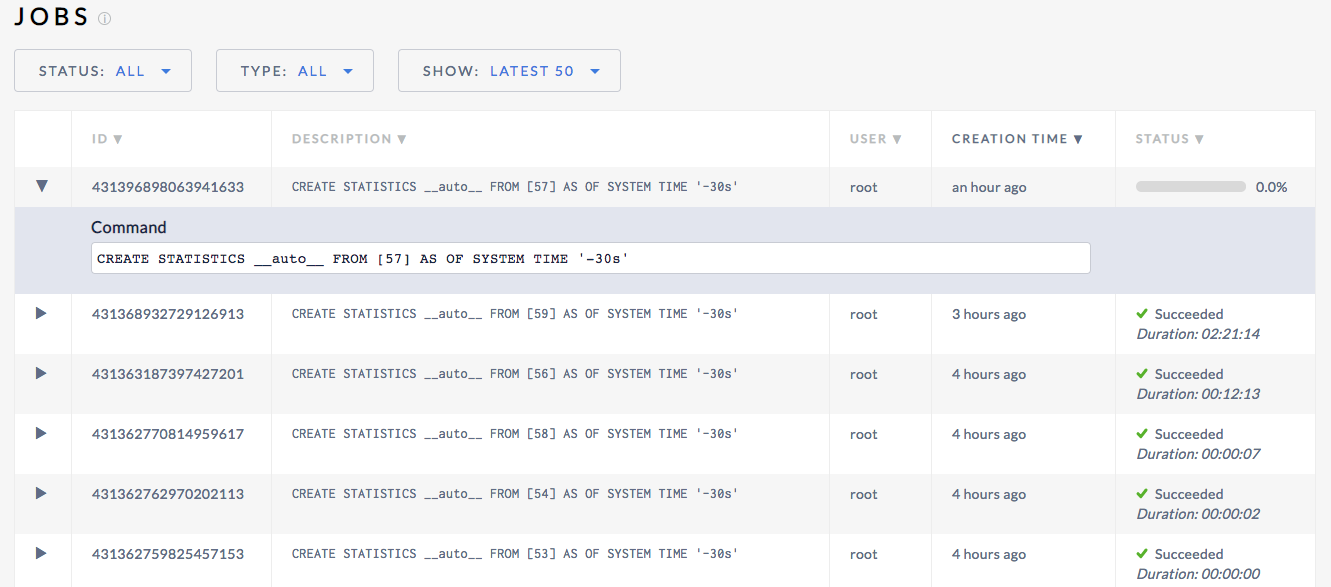
It also appears to block two other jobs from completing which is good behavior while it is long-running
awoods187
on 4 Mar 2019
I think the throttling mechanism might be contributing here too. If there's a 1 minute slowdown for whatever reason, it will then wait 9 minutes. We should put a cap on how much we sleep each time.
 RaduBerinde
on 4 Mar 2019
RaduBerinde
on 4 Mar 2019
Here's an example under larger load (TPC-C 10k). A 4 node 72 cpu connection:
awoods187
on 4 Mar 2019
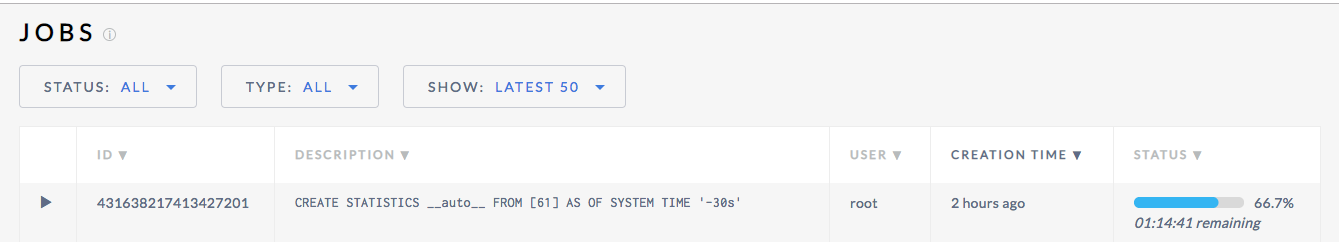
And here's a 7 node 36 cpu 10k with an 8 hour wait time!
awoods187
on 4 Mar 2019
The progress (and thus "remaining") estimation is very crude at this point, it will require non-trivial work to make it significantly better. I want to separate that issue from the problem of the operation taking significantly longer than we expect. I'd be curious how long that "8hr remaining" job actually takes.
We errored on the side of more throttling to minimize regressions in user-facing workloads, so it may not be unexpected that it takes on the order of hours in this case. #35352 may help though.
RaduBerinde
on 4 Mar 2019
I renamed this issue so it tracks the jobs taking too long. I filed a separate issue #35360 for the progress estimation.
RaduBerinde
on 4 Mar 2019
Yeah i think that makes sense.
Here is an example of some long running jobs on tpc-c 10K on 7 36 cpu nodes
awoods187
on 5 Mar 2019
Here's an example of tpc-c 2500 on 3 16 cpu nodes:
awoods187
on 5 Mar 2019
@awoods187 could you run a full table scan on one of these setups and see how long it takes?
You can run:
PREPARE a AS SELECT * FROM [61 AS t];
EXECUTE a DISCARD ROWS;
where 61 is the table id in the job description
RaduBerinde
on 5 Mar 2019
root@localhost:26257/tpcc> SHOW STATISTICS FOR TABLE stock;
  statistics_name |  column_names  |             created              | row_count | distinct_count | null_count | histogram_id
+-----------------+----------------+----------------------------------+-----------+----------------+------------+--------------+
  __auto__        | {s_w_id}       | 2019-03-05 17:10:18.803438+00:00 | 250000000 |           2500 |          0 |         NULL
  __auto__        | {s_i_id}       | 2019-03-05 17:10:18.803438+00:00 | 250000000 |         101273 |          0 |         NULL
  __auto__        | {s_quantity}   | 2019-03-05 17:10:18.803438+00:00 | 250000000 |             91 |          0 |         NULL
  __auto__        | {s_dist_01}    | 2019-03-05 17:10:18.803438+00:00 | 250000000 |      247395214 |          0 |         NULL
  __auto__        | {s_dist_02}    | 2019-03-05 17:10:18.803438+00:00 | 250000000 |      248649081 |          0 |         NULL
  __auto__        | {s_dist_03}    | 2019-03-05 17:10:18.803438+00:00 | 250000000 |      248606115 |          0 |         NULL
  __auto__        | {s_dist_04}    | 2019-03-05 17:10:18.803438+00:00 | 250000000 |      248441310 |          0 |         NULL
  __auto__        | {s_dist_05}    | 2019-03-05 17:10:18.803438+00:00 | 250000000 |      249631103 |          0 |         NULL
  __auto__        | {s_dist_06}    | 2019-03-05 17:10:18.803438+00:00 | 250000000 |      252488108 |          0 |         NULL
  __auto__        | {s_dist_07}    | 2019-03-05 17:10:18.803438+00:00 | 250000000 |      250007052 |          0 |         NULL
  __auto__        | {s_dist_08}    | 2019-03-05 17:10:18.803438+00:00 | 250000000 |      249047125 |          0 |         NULL
  __auto__        | {s_dist_09}    | 2019-03-05 17:10:18.803438+00:00 | 250000000 |      248726773 |          0 |         NULL
  __auto__        | {s_dist_10}    | 2019-03-05 17:10:18.803438+00:00 | 250000000 |      252109138 |          0 |         NULL
  __auto__        | {s_ytd}        | 2019-03-05 17:10:18.803438+00:00 | 250000000 |              1 |          0 |         NULL
  __auto__        | {s_order_cnt}  | 2019-03-05 17:10:18.803438+00:00 | 250000000 |              1 |          0 |         NULL
  __auto__        | {s_remote_cnt} | 2019-03-05 17:10:18.803438+00:00 | 250000000 |              1 |          0 |         NULL
  __auto__        | {s_data}       | 2019-03-05 17:10:18.803438+00:00 | 250000000 |      250653055 |          0 |         NULL
(17 rows)

Time: 3.079451ms
And then the test:
root@localhost:26257/tpcc> PREPARE a AS SELECT * FROM stock;                                                                                                                                                           EXECUTE a DISCARD ROWS;
PREPARE

Time: 1.831785ms


  s_i_id | s_w_id | s_quantity | s_dist_01 | s_dist_02 | s_dist_03 | s_dist_04 | s_dist_05 | s_dist_06 | s_dist_07 | s_dist_08 | s_dist_09 | s_dist_10 | s_ytd | s_order_cnt | s_remote_cnt | s_data
+--------+--------+------------+-----------+-----------+-----------+-----------+-----------+-----------+-----------+-----------+-----------+-----------+-------+-------------+--------------+--------+
(0 rows)

Time: 9m15.874739523s
After talking it over with @RaduBerinde we expect that because the throttling makes statistics sleeps 90% of the time, this job should take ~90minutes
awoods187
on 5 Mar 2019
It looks like it took much longer than 90 minutes:

awoods187
on 5 Mar 2019
I see, thanks! The 90 minutes estimation doesn't take into account the resources to actually calculate stats from the data, though the discrepancy seems excessive. Can you run a CREATE STATISTICS foo FROM stock AS OF SYSTEM TIME '-30s' and see how long that job takes?
RaduBerinde
on 5 Mar 2019
root@localhost:26257/tpcc> CREATE STATISTICS foo FROM stock AS OF SYSTEM TIME '-30s';
CREATE STATISTICS

Time: 10m48.395233537s
Thanks! So it should be taking 110 minutes not 160. Perhaps there is something about the throttling mechanism that isn't quite right.
RaduBerinde
on 6 Mar 2019
I will try to repro at a smaller scale.
RaduBerinde
on 6 Mar 2019
In a local tpcc setup I'm seeing manual stats on order_line taking 10s manually and 2m19s for auto stats. There is definitely some unexpected discrepancy. One possibility is that we're sleeping too often for very short periods and the sleep takes longer. I will continue investigating.
RaduBerinde
on 6 Mar 2019
Sleep can sleep more than asked (first value is what we pass to Sleep, the second value is the before and after timeutil.Now() difference):
Sleep for 6.727510449s, actual 6.95398141s
Sleep for 7.228570293s, actual 7.312928452s
Sleep for 5.997811176s, actual 6.043456589s
Sleep for 8.824384773s, actual 9.045990561s
Still doesn't seem large enough to account for the discrepancy, but it should be easy enough to fix.
RaduBerinde
on 6 Mar 2019
I set up tracing and I see something very interesting. It looks like the transactions related to jobs infrastructure (left side in the image) are about the same frequency as the actual scans (right side):
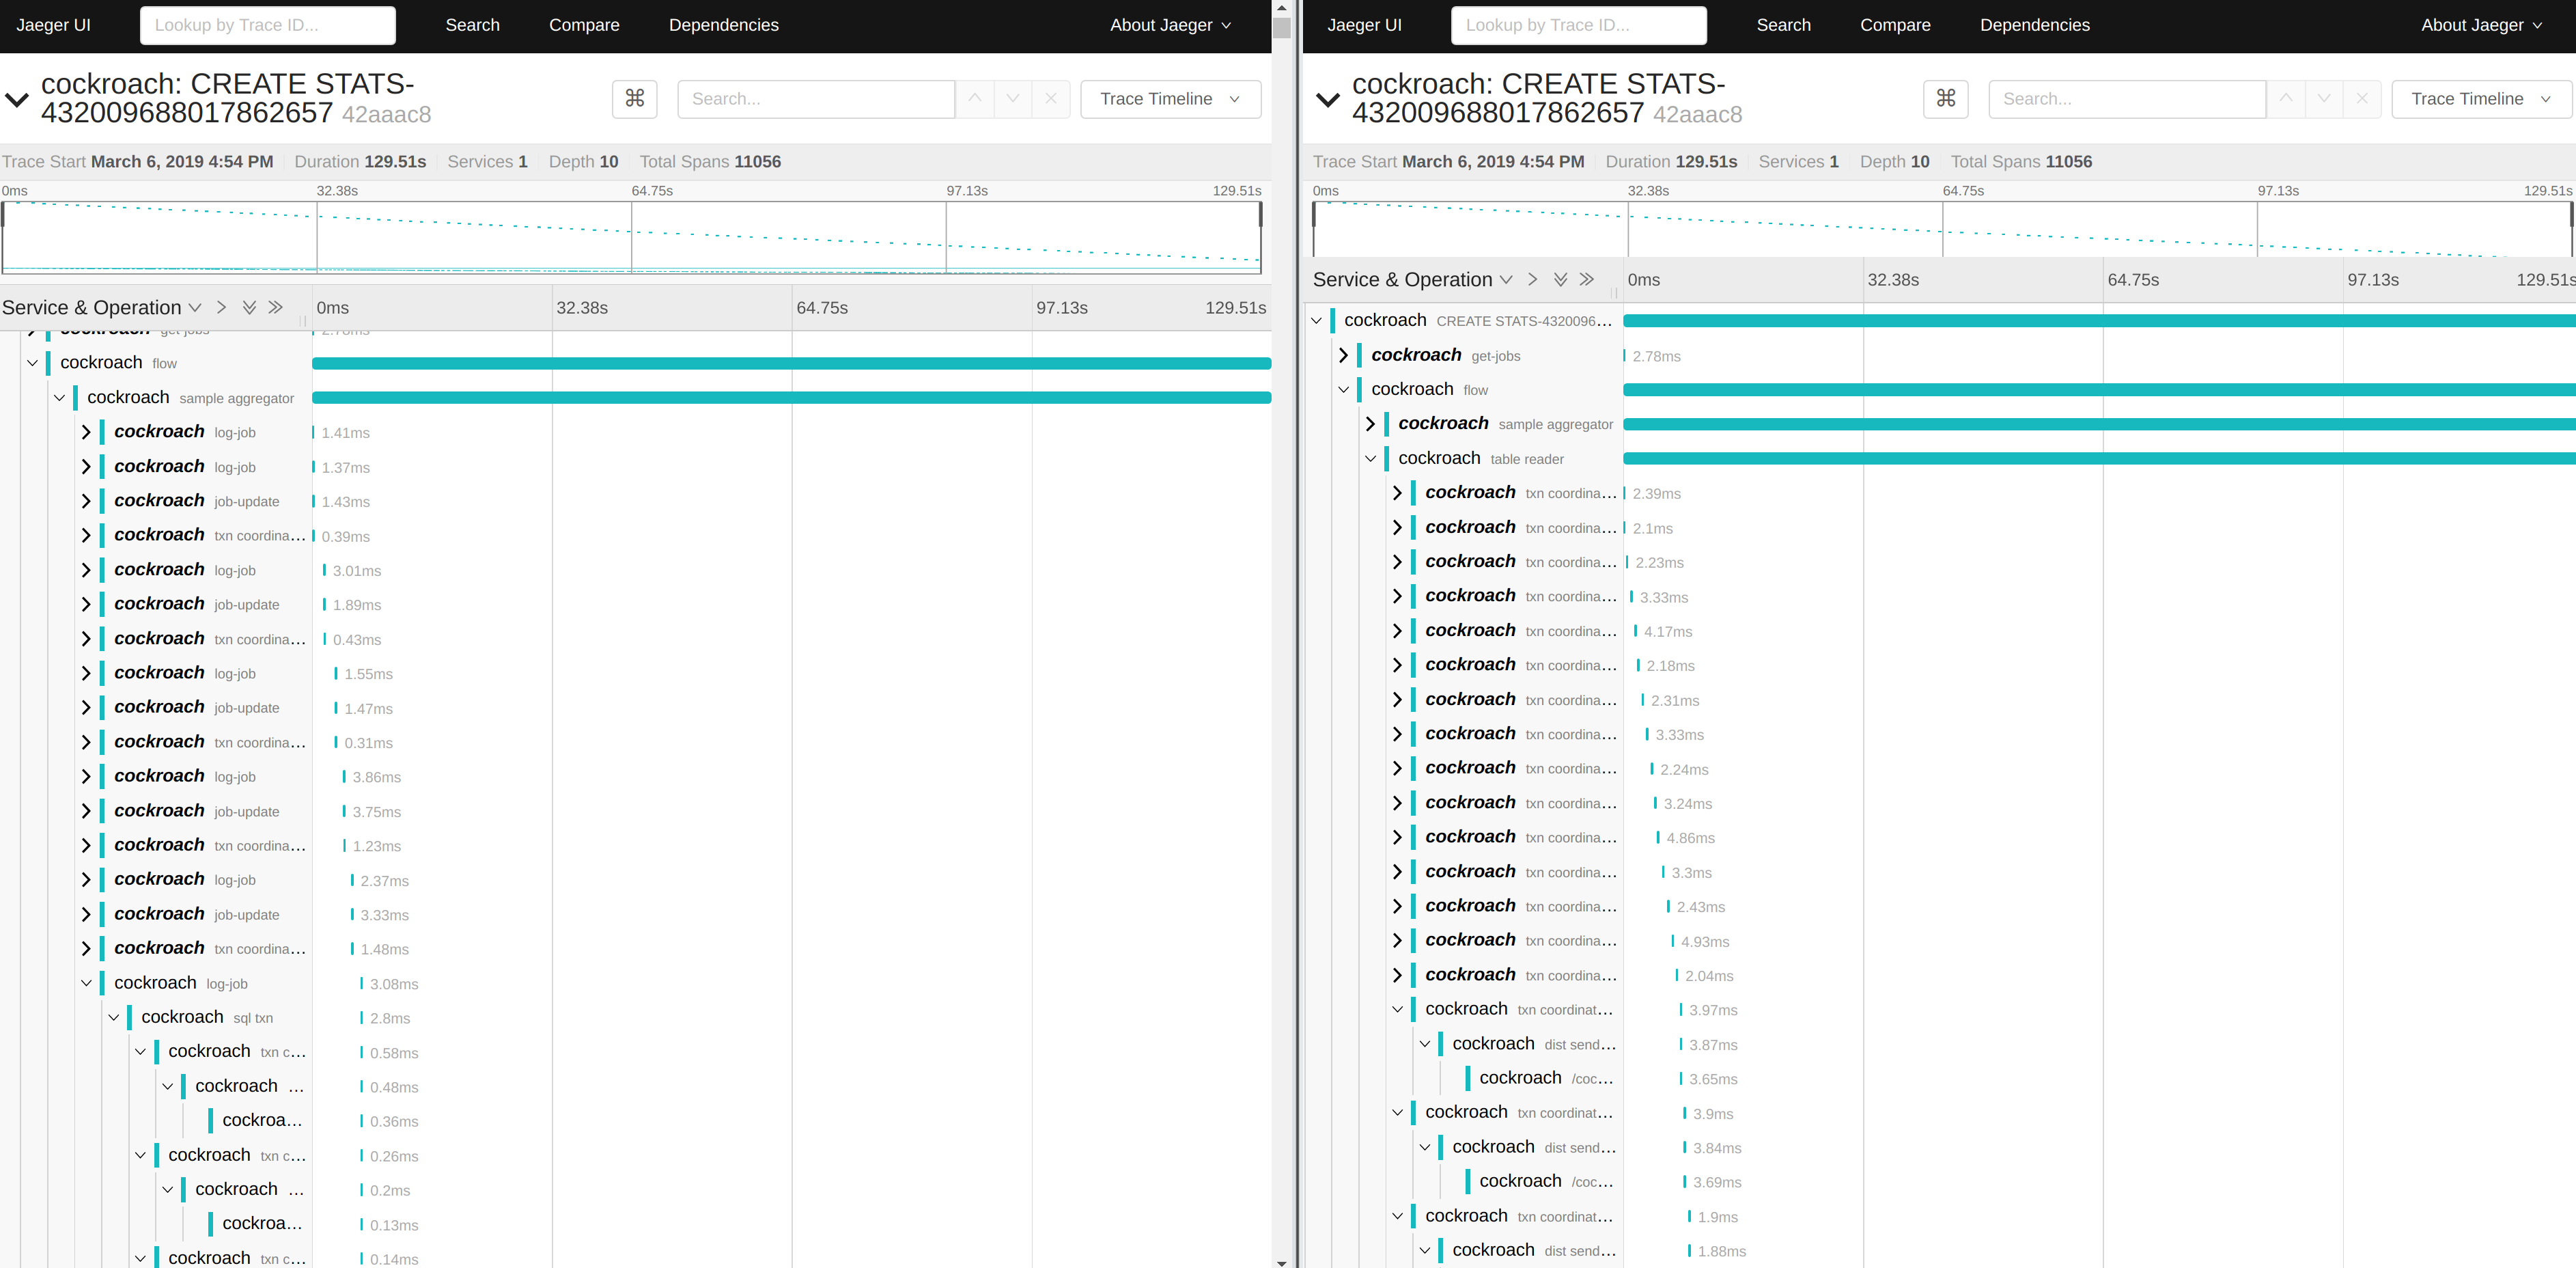
We update progress every second. This is ok when it's not being throttled, but when we're mostly sleeping it becomes a significant part of the work. The good news is that we should lessen the impact of auto stats on a running cluster once we fix this.
RaduBerinde
on 6 Mar 2019
CC @rytaft
RaduBerinde
on 6 Mar 2019
Awesome find @RaduBerinde
awoods187
on 7 Mar 2019
I think what I found was some unnecessary resource usage (which will be good to fix) but this still doesn't fix the longer automatic stats. It seems that scanning the table is actually slower when done this way. Perhaps some cache along the way in KV gets cold.
Here's an example of how long 10,000 rows take to process without throttling:
10000 rows took 25.055453ms
10000 rows took 26.77369ms
10000 rows took 29.990449ms
10000 rows took 26.665921ms
10000 rows took 26.599912ms
10000 rows took 26.842333ms
10000 rows took 26.31515ms
10000 rows took 27.229854ms
10000 rows took 24.395232ms
10000 rows took 24.660581ms
With throttling we sleep in-between the scans, but they should otherwise be the same operations:
10000 rows took 24.596043ms
10000 rows took 57.350182ms
10000 rows took 23.21117ms
10000 rows took 24.751616ms
10000 rows took 58.55993ms
10000 rows took 24.240551ms
10000 rows took 59.503829ms
10000 rows took 23.251972ms
10000 rows took 25.518838ms
10000 rows took 53.857323ms
Note how one in 2-3 ops is much slower.
I will experiment with reducing the scan batch size and doing smaller batches.
RaduBerinde
on 7 Mar 2019
Interestingly, it's not the KV operation that is taking longer. Here are messages about 10,000 rows intermingled with how long the KV scan took. So it seems there is something odd happening in the distsql layer.
10000 rows took 23.675644ms
scan batch took 3.187535ms
10000 rows took 24.230303ms
scan batch took 2.742577ms
10000 rows took 56.445017ms
scan batch took 2.78203ms
10000 rows took 57.586679ms
I have created a simple reproduction of how things take longer than expected when we throttle: https://github.com/RaduBerinde/playground/blob/3fcb117776f62a5b20a3d397eec3d85cb4b8ad4d/throttle/main.go#L21
This is very puzzling.
RaduBerinde
on 11 Mar 2019
I figured it out, more details in https://github.com/golang/go/issues/30740
The TL;DR is that it's just an inefficient way to use a modern CPU that is otherwise idle.
I think the most beneficial solution here would be to be more adaptive in terms of how much we throttle. In particular, it's silly to throttle so much when the system is idle (or under low load). We should look at recent CPU metrics and adjust the throttling accordingly.
RaduBerinde
on 11 Mar 2019
Nice sleuthing!
 rytaft
on 11 Mar 2019
rytaft
on 11 Mar 2019
Related issues
 petermattis
·
4Comments
petermattis
·
4Comments
 melskyzy
·
3Comments
melskyzy
·
3Comments
 nvanbenschoten
·
3Comments
nvanbenschoten
·
3Comments
 tim-o
·
3Comments
tim-o
·
3Comments
 ajwerner
·
4Comments
ajwerner
·
4Comments
Most helpful comment
I figured it out, more details in https://github.com/golang/go/issues/30740
The TL;DR is that it's just an inefficient way to use a modern CPU that is otherwise idle.
I think the most beneficial solution here would be to be more adaptive in terms of how much we throttle. In particular, it's silly to throttle so much when the system is idle (or under low load). We should look at recent CPU metrics and adjust the throttling accordingly.