Cms: Project config page taking to long to load
Description
The newly added Project Config page takes really long to load on a large project.
_Note that this is on localhost with PHP running on Ubuntu, can't get faster than that._
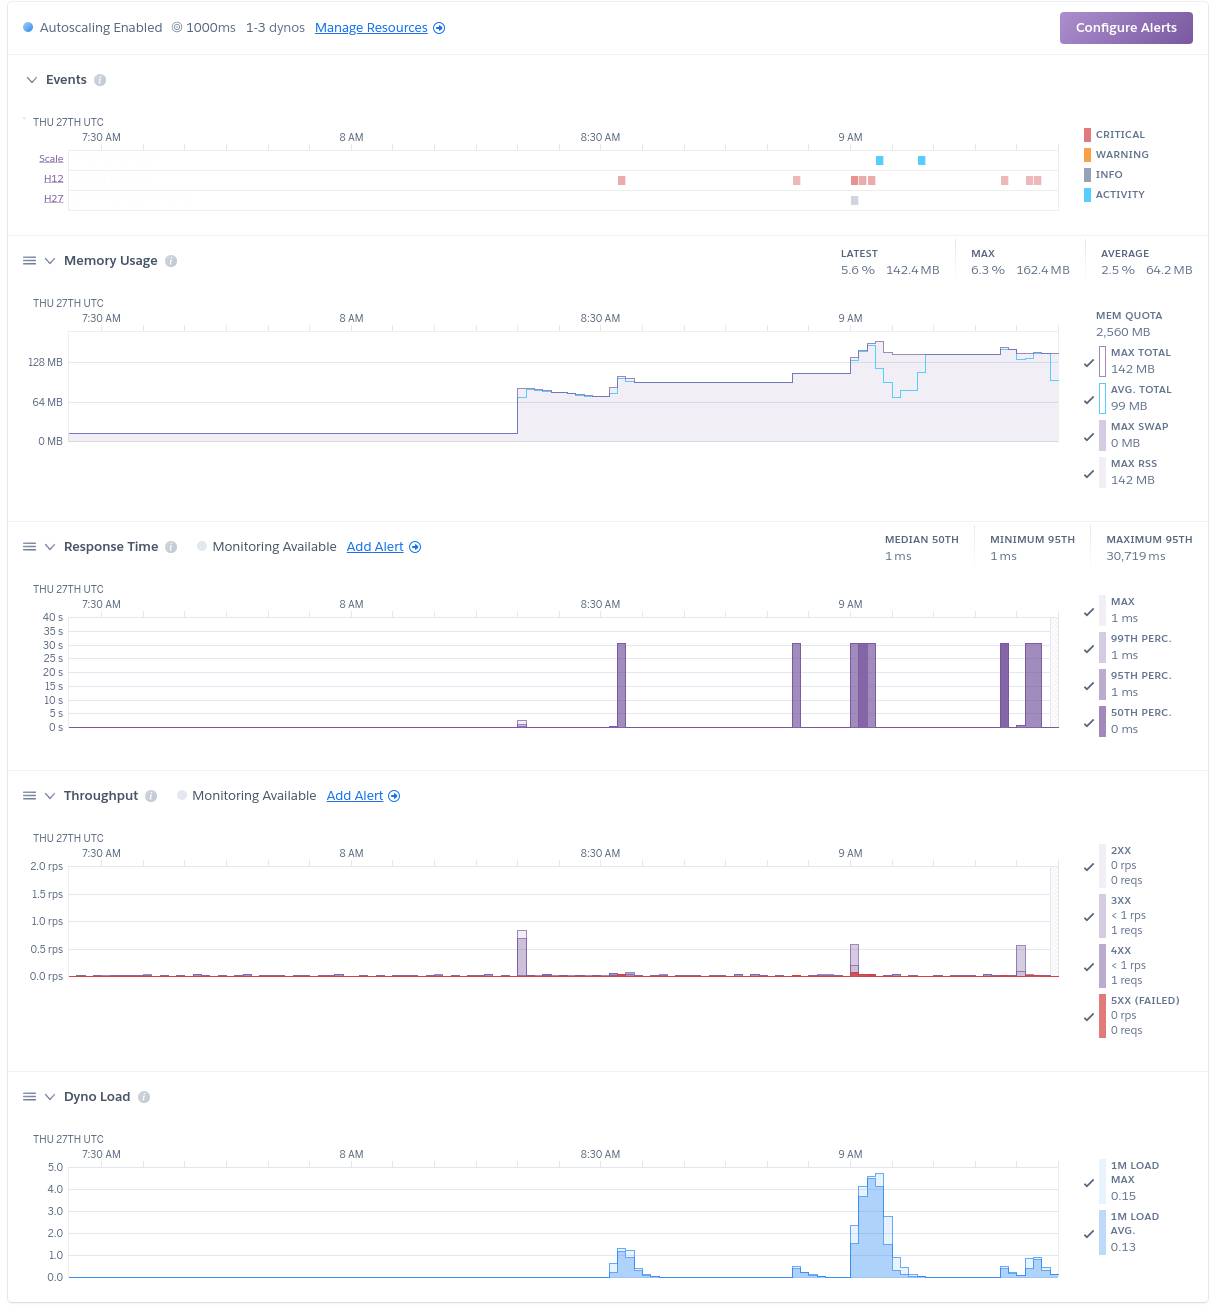
The problem is this won't fly for Heroku. Heroku has a max limit of 30 seconds for the max execution time. Reference
We are maxing out our Heroku, it tries to scale even with the PM instance, nothing. Can't complete it under 30 seconds.
I tried to profile the page it is basically unresponsive. I got it to expand but can't open anything because the browser becomes unresponsive.

Steps to reproduce
- Get a large project
- Navigate to
/admin/utilities/project-config - Watch it burn :fire:
Additional info
Here is some additional info on how large our project files are.
Language                     files          blank        comment           code
-------------------------------------------------------------------------------
YAML                           311              0              0          18183
-------------------------------------------------------------------------------
SUM:                           311              0              0          18183
-------------------------------------------------------------------------------
| Module | Version |
|---------------------------|---------------------------------------|
| PHP version | 7.4.3 |
| OS version | Linux 5.4.0-42-generic |
| Database driver & version | MySQL 5.5.5 |
| Image driver & version | Imagick 3.4.4 (ImageMagick 6.9.10-23) |
| Craft edition & version | Craft Pro 3.5.6 |
| Yii version | 2.0.36 |
| Twig version | 2.12.5 |
| Guzzle version | 6.5.5 |
| Imagine version | 1.2.3-dev |
 ilicmarko
All 11 comments
Same issue from the CLI:
./craft project-config/diff 114.25s user 1.25s system 96% cpu 1:59.93 total
 Mosnar
on 27 Aug 2020
Mosnar
on 27 Aug 2020
Yep have seen this too - indeed it has taken down my entire browser (or at least several tabs) (Firefox latest on Win64) - on more than one occasion. Have now banned myself from visiting that tab!!
(worth saying though that other than this I am finding project config much improved and it's a delight to be able to make fields on dev and push out to production now it all mostly seems to be working very well!)
 bossanova808
on 28 Aug 2020
bossanova808
on 28 Aug 2020
I can see how generating the diff could take a while, but…
indeed it has taken down my entire browser (or at least several tabs)
@bossanova808 are you saying that it’s causing your browser tab to crash (as in you can’t even point the tab to a different website like Google)? Or are you just getting impatient while waiting for the page to load? If the former, that would indicate a very huge diff that the JS is failing to handle. If you run the project-config/diff command, do you find that to be the case?
 brandonkelly
on 28 Aug 2020
brandonkelly
on 28 Aug 2020
(And to clarify, it could _feel_ like the browser tab had crashed because it won’t even load other pages of your site – but that could just be because the server itself is not ready to accept a new connection since it’s still processing the /admin/utilities/project-config request, even though you have tried to navigate away from it. So that’s why it’s best to test by going somewhere completely different like Google.)
brandonkelly
on 28 Aug 2020
Ok, I don't actually run diffs on the comman line TBH (just rebuild if I pull a production DB, and apply when I deploy changes).
Running now on my dev server just as a test...took about a minute. Suprised to see it outputting a diff, though, really, as the dev db is a recent production db with PC re-built after pulling that..
e.g. lots like this...
...
            removeEmptyTags: ''
            removeInlineStyles: ''
            removeNbsp: ''
-           showHtmlButtonForNonAdmins: false
+           showHtmlButtonForNonAdmins: true
            showUnpermittedFiles: false
            showUnpermittedVolumes: true
            uiMode: enlarged
in all maybe 3 or 400 lines of diff result (is that expected, doesn't make immediate sense to me?)
Anyway, what happens is I go to the Project Config page in Utilities. Initially things seem ok, but then the page appears to hang. and no input is accepted. If I go to another window and come back, the page is gone and there's nothing but a spinning wheel in the centre. In that browser tab I can not do anything - I can't go to another page on my own site, and it wont let me go to e.g. google.com. The tab is, for all intents and purposes, dead to me. Possibly if I leave it a great deal of time it might come back, but so for I haven't had the patience. In another tab, I can go to the Craft dashboard jsut fine, though, while this is happening - so it's not the server being busy as such. Perhaps 'crash' is too strong a word, but it's certainly hung.
Oddly, when this one tab is crashed, if I go to other, non related tabs - msot seem ok, but occasionally I just see a spinning wheel there too, I think because the browser is so tied up it's not re-drawing the tab I've naviagted to...that's what it feels like anyway.
The whole thing definitely feels like JS running amok, if I had to guess.
Let me know if there is anything I can do/test to help...
bossanova808
on 29 Aug 2020
As a test, I just pulled the production db again, and then ran a diff after that - no pending changes is reported, which is what I'd expect....but I definitely ran a project-config/rebuild after the last pull (it's part of my ansible deploy processes) - so I'm still not sure why there'd have been that diff mentioned above.
So, immediately after pulling the production db, and confirming no changes are peniding via a CLI diff, if I navigate to the PC window, it hangs that browser tab as previously described. In another window or browser I can load the main dashboard page with no issue, and the server is not generally overloaded at all (no cpu/mem issues in top etc).
That said, I was wrong - I can actually manually type google into the address bar and then navigate OK away. I thought I'd tried that and failed, but apparently not...leastwise, this time I could do it.
(Sorry for all the messages, hope this info is useful!)
bossanova808
on 29 Aug 2020
I have the same issue with one of my 2 Apple Macbook air machines with Google Chrome.
- The 13" air takes 10+ seconds to load the page
- The 11" air takes 1 second to load the page
Both on the same staging url of 2 different projects. It's giving the same results.
It might be browser issue here?
I'm not at home to test on both machine at the same time but when im able to i will give an update on this.
Edit: Did some profiling for those two machines with the same project url and both on Chrome. I see different results on the Scripting part. Both profiles are +- 25 seconds
- Chrome version on both machines: Version 84.0.4147.135 (Official Build) (64-bit)
- This occurs on other projects too
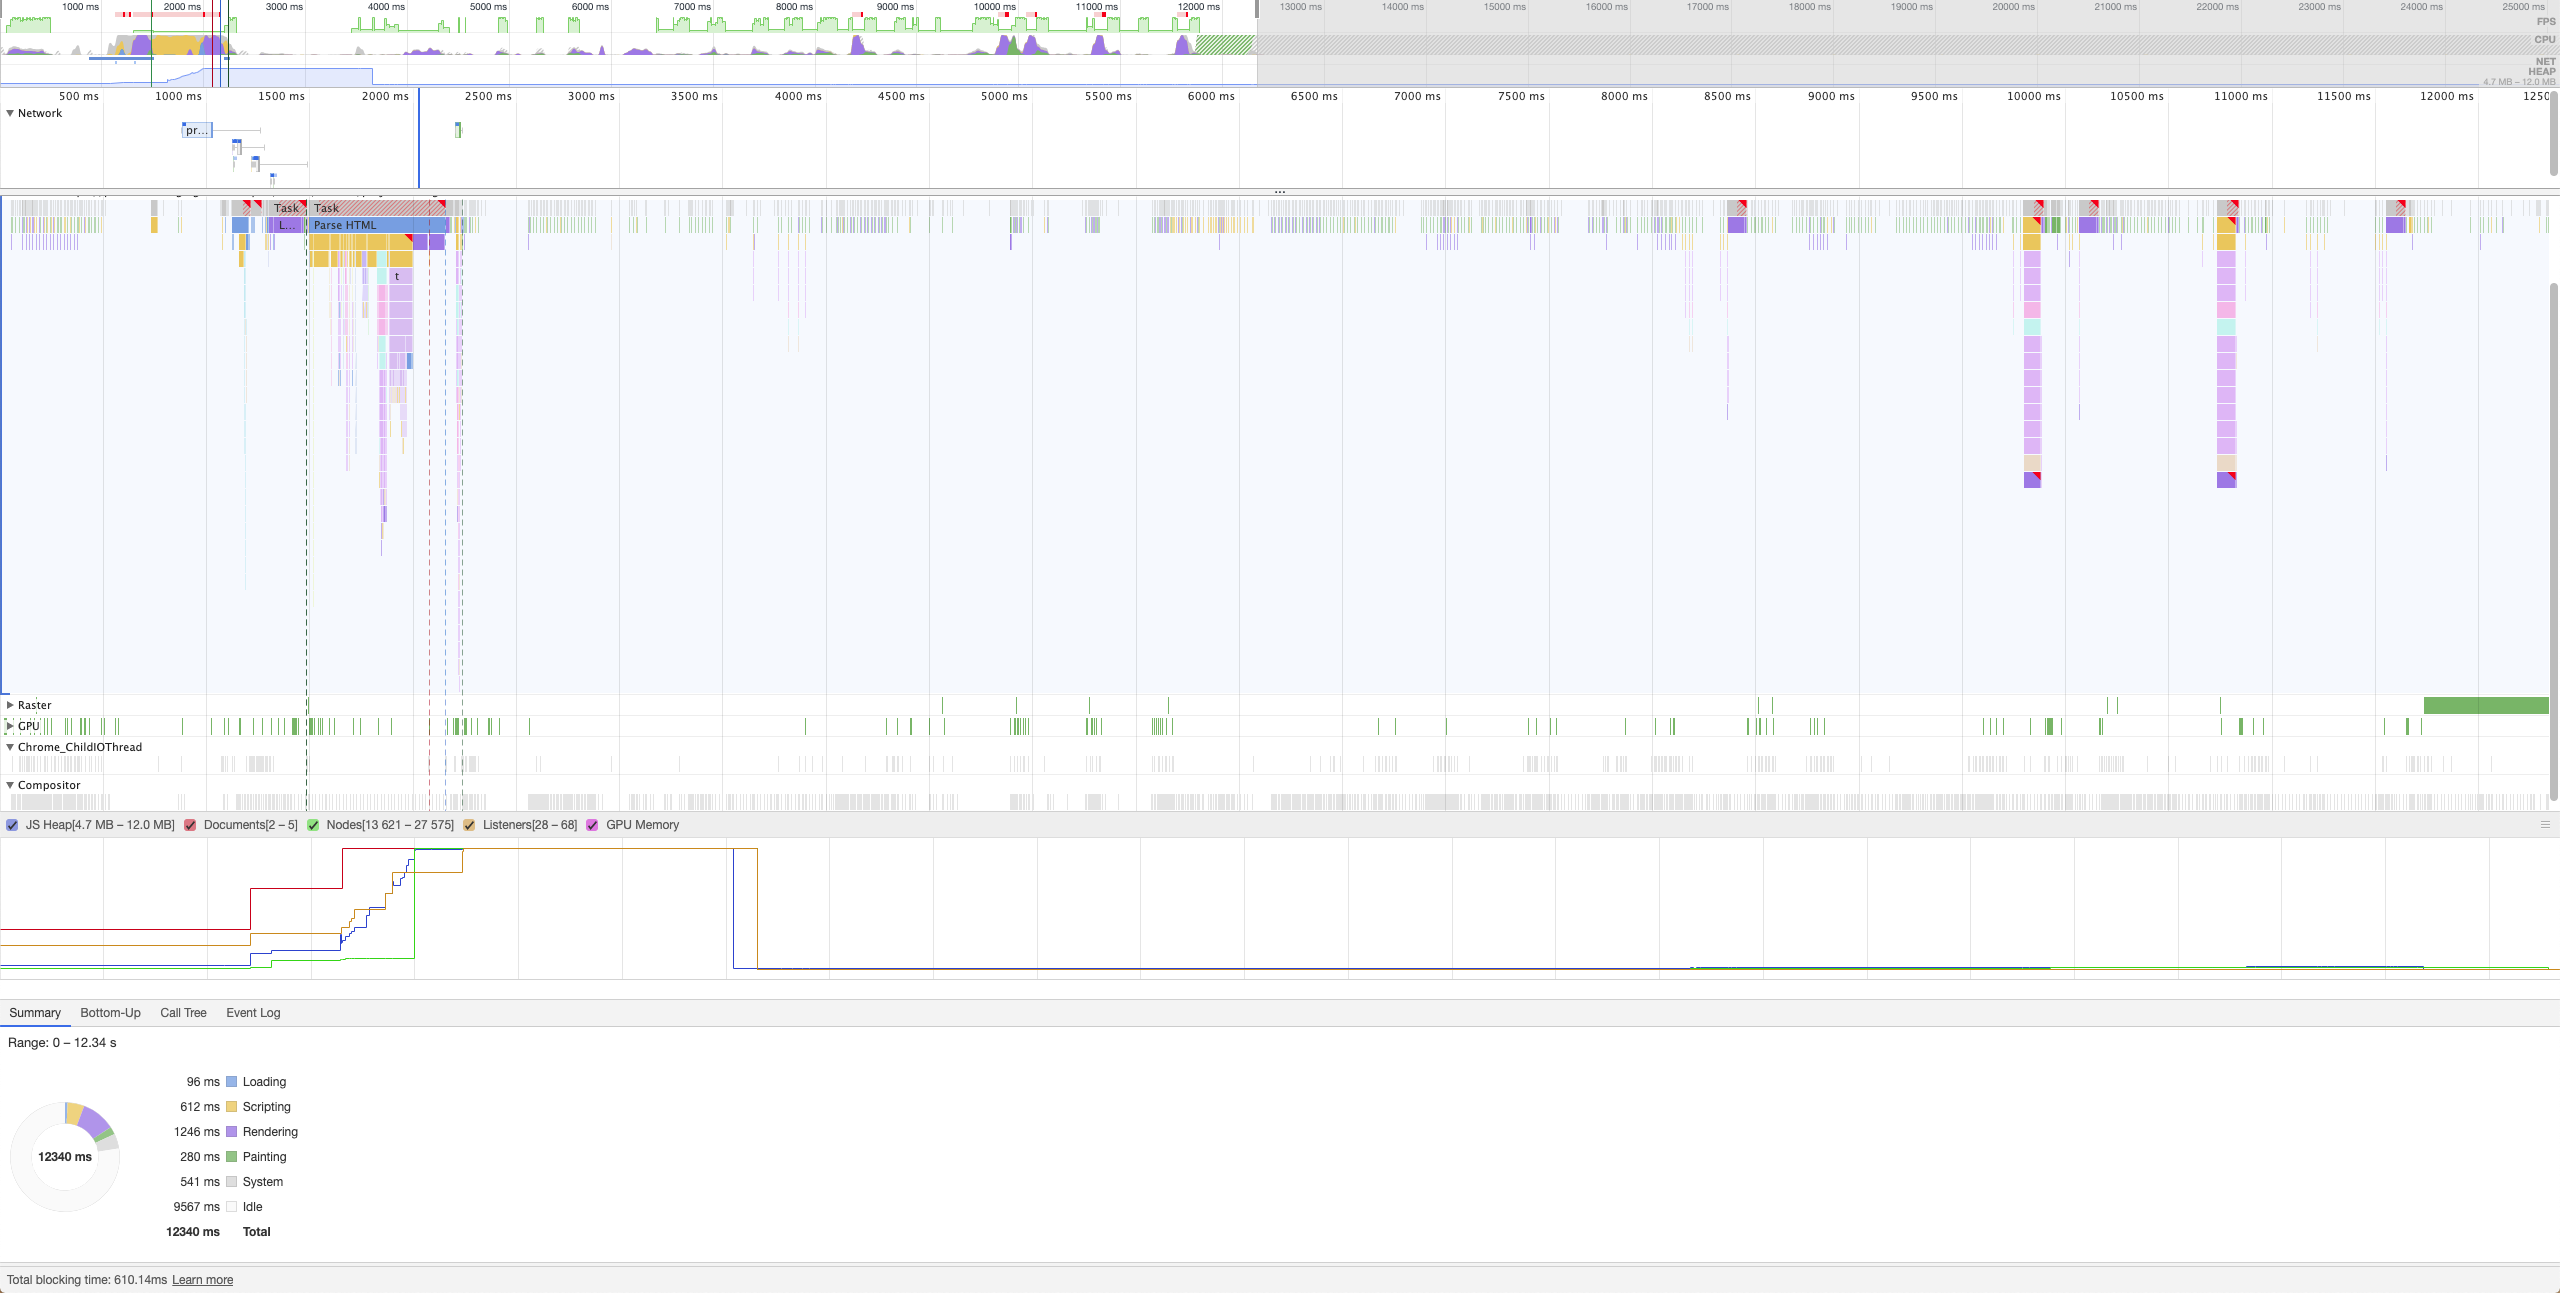
Non blocking (page responsive in less than a second / 11' macbook air)
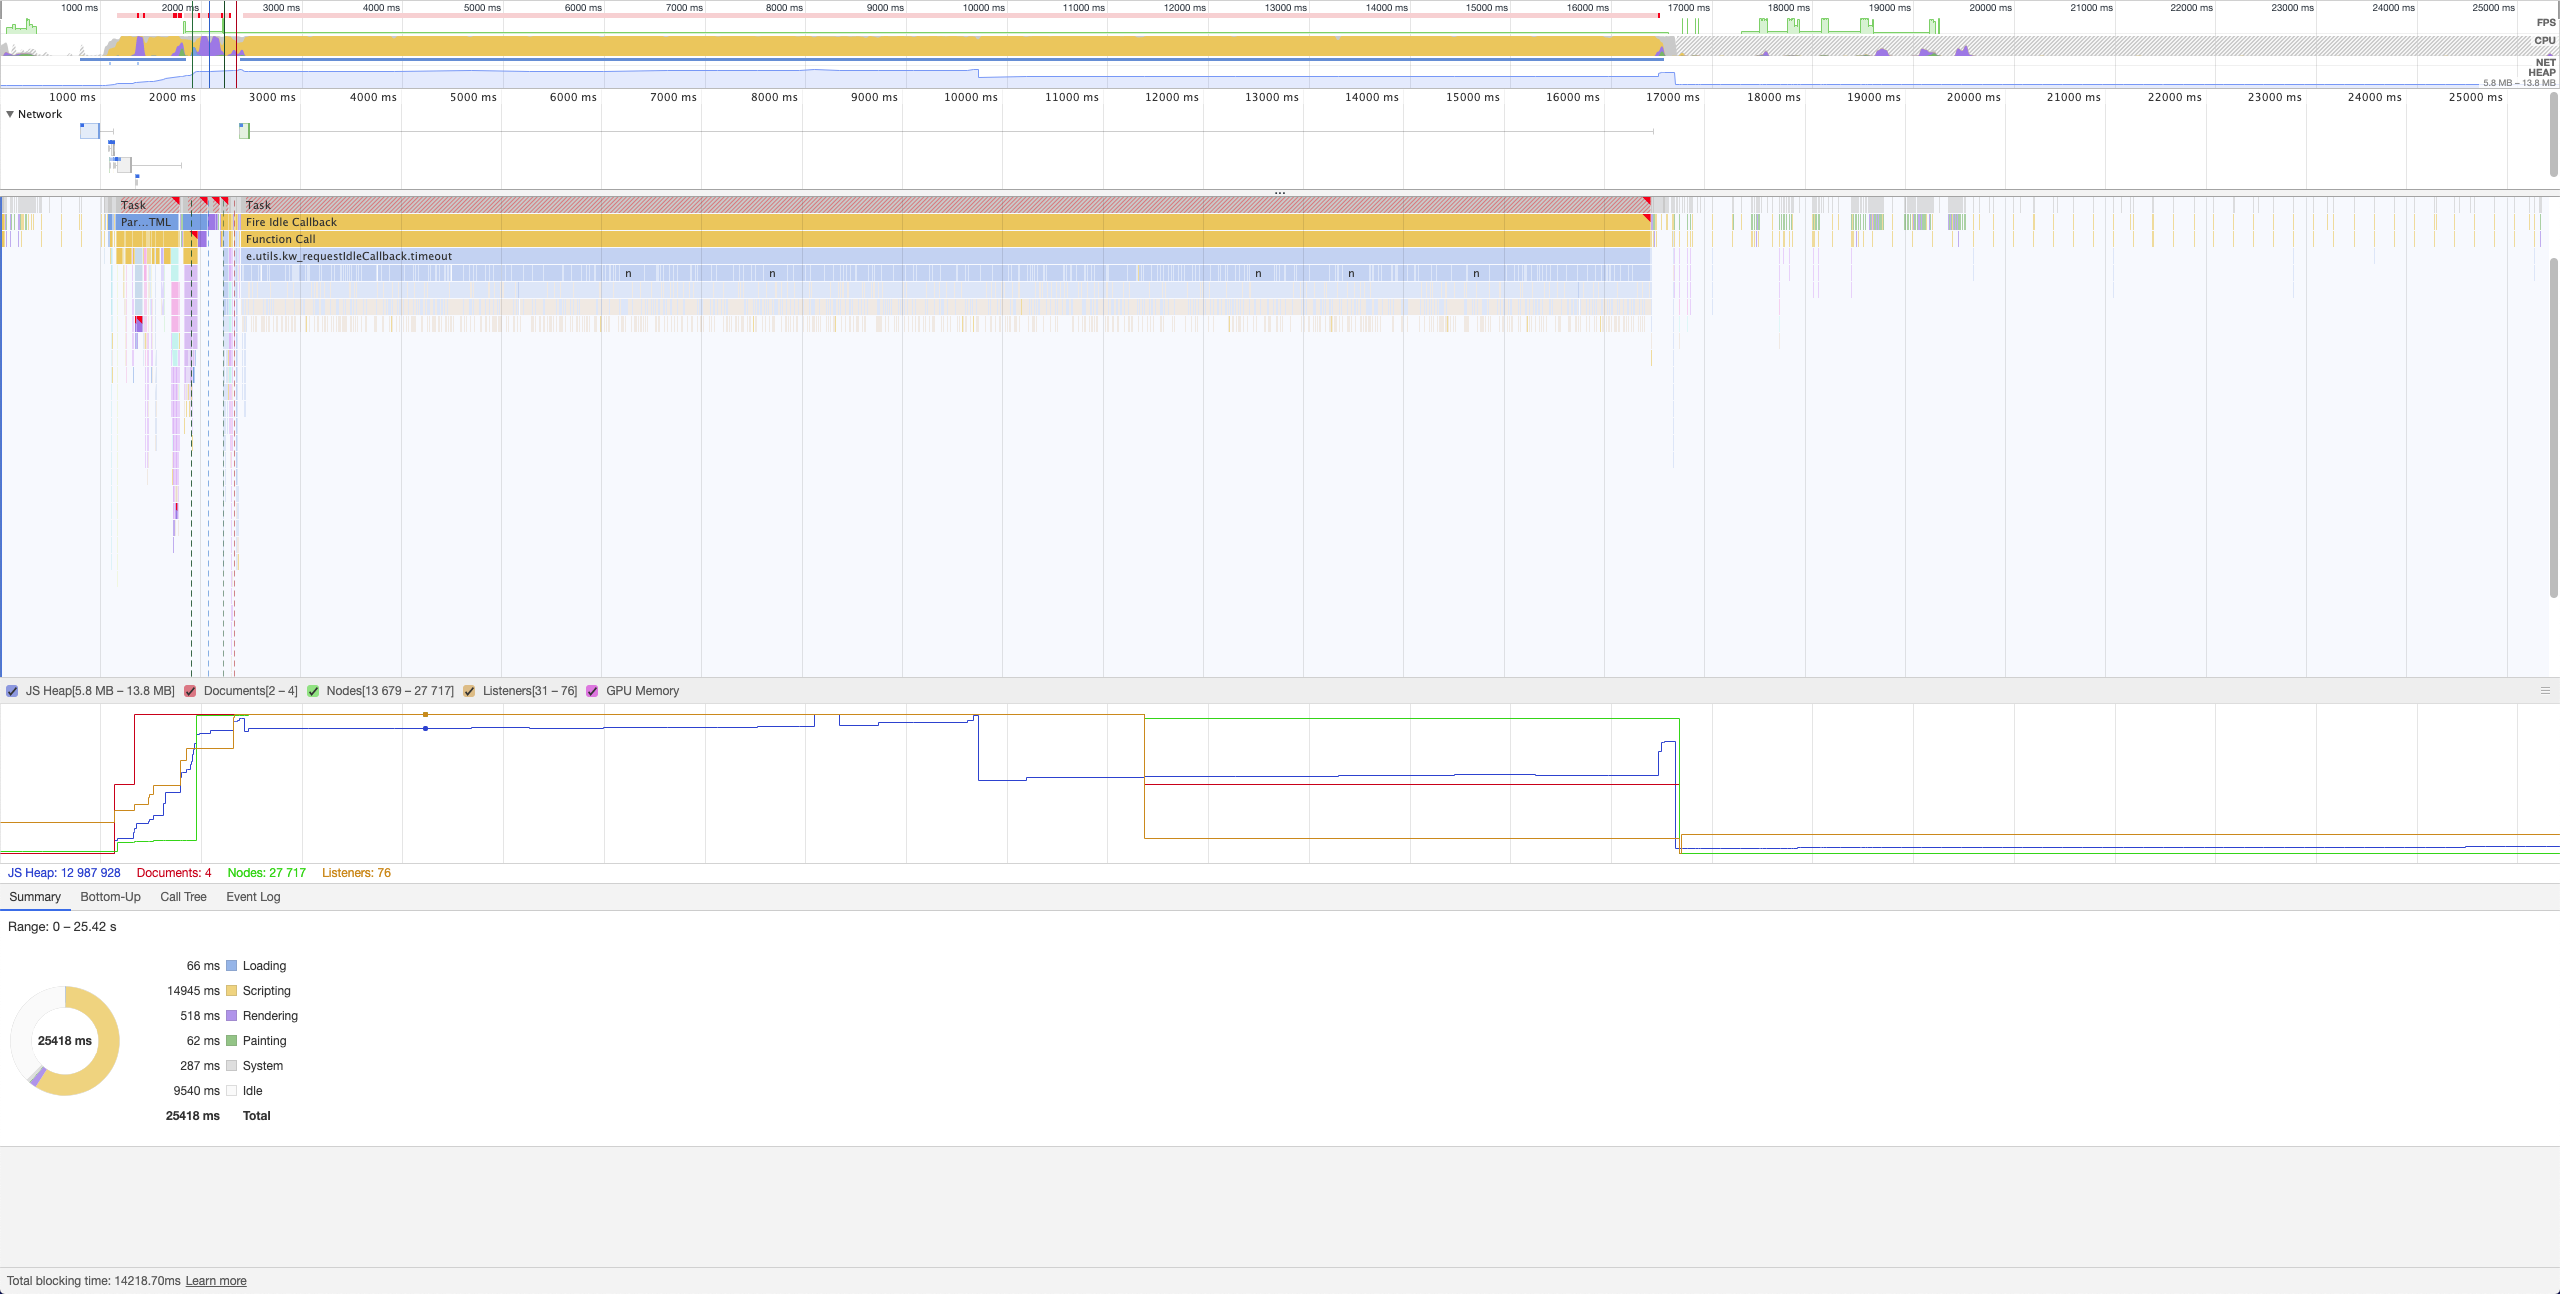
Blocking (page responsive in more than 15 seconds / 13' macbook air)
 aphichat
on 30 Aug 2020
aphichat
on 30 Aug 2020
I did a bit more testing, really lacking time on my end. But there are multiple factors here.
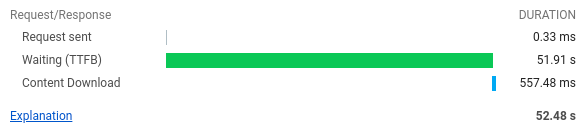
- The long response time
It is due to diff taking really long time on the server end. You can confirm this by resolving the diff in the console and opening the page. The TTFB will drop from ~60s to 1s.
- Page breaking
This is partly because of the browser and maybe what @brandonkelly but can't confirm it. Once you open the page there is a spike in heap size but far more importantly dom nodes. This is the key to why the browser breaks.
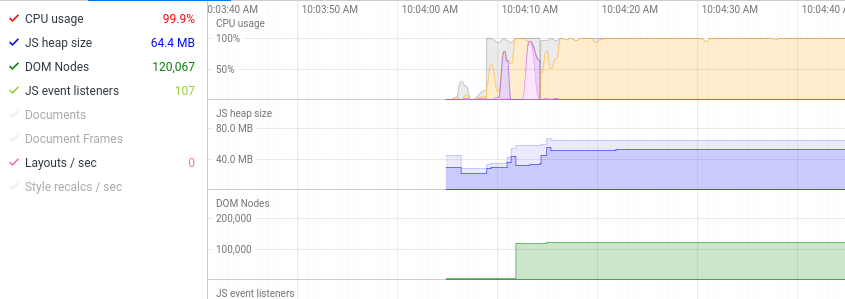
For my config, I have around 16 000 lines of config, run a syntax highlighting on that and you can see in the graph what happens. It generates around 120 000 DOM Nodes :rofl:
There a few ways to solve this problem. For me personally remove the Loaded Project Config Data, I don't see a use for it, no one will scroll 10 000 lines of YAML to find something.
Another solution is to segment it like the actual files and only highlight the one that is open.
Removing syntax highlighting will also fix this.
ilicmarko
on 31 Aug 2020
Just made the following changes for the next release:
- The diff is now loaded over Ajax, so the rest of the page will load right away.
- If you navigate away from the page while the diff is loading, the diff request will be cancelled. (That may not actually prevent the server from processing the request, but it’s the most we can do to tell PHP to pack it up.)
- If the diff is over 20 lines, only the first 20 lines will be shown initially, with a “View all changes” link that reveals the rest of it.
- Diffs are now cached, so once you have loaded it once, it won’t be regenerated until either the loaded project config changes, or the YAML files change.
- The “Loaded Project Config Data” section no longer has syntax highlighting.
brandonkelly
on 31 Aug 2020
Craft 3.5.8 is out now with those changes.
brandonkelly
on 1 Sep 2020
This came up again (#7218) so it’s worth mentioning here that Craft 3.6 is going to have dramatically faster project config diffing, thanks to a new custom diff function.
brandonkelly
on 12 Dec 2020
Related issues
 mattstein
·
3Comments
mattstein
·
3Comments
 timkelty
·
3Comments
timkelty
·
3Comments
 michaelhue
·
3Comments
michaelhue
·
3Comments
 benface
·
3Comments
benface
·
3Comments
 bitboxfw
·
3Comments
bitboxfw
·
3Comments