Cms: HTTP 504 Gateway Timeout on GraphQL since 3.4 (3.4.1) upgrade
Description
Since upgrading to Craft 3.4.1, and upgrading all plugins accordingly, I am getting 504 Gateway Time Out almost all GraphQL requests.
Site is running on Docker with all install conditions met.
Have even tried setting max_execution_time to 2000 and memory_limit to 512.
Have also tried with devMode off and all plugins disabled.
Have also removed vendor folder and composer.lock file and reinstalled.
Site responds quickly when docker box is first restarted. But times out in subsequent requests.
Additional info
- Craft version: 3.4.1
- PHP version: 7.4.0
- Database driver & version: MySQL 5.5.5
- Plugins & versions:
Control Panel Nav 3.0.0
Feed Me 4.2.0.1
Navigation 1.3.0
Phone Number 1.3.0
Redactor 2.5.0
Redactor Custom Styles 3.0.2
Reverse Relations 1.1.7
Title to Sidebar 1.0.1
Vertical Tabs 1.0.0

 davebeesley
All 46 comments
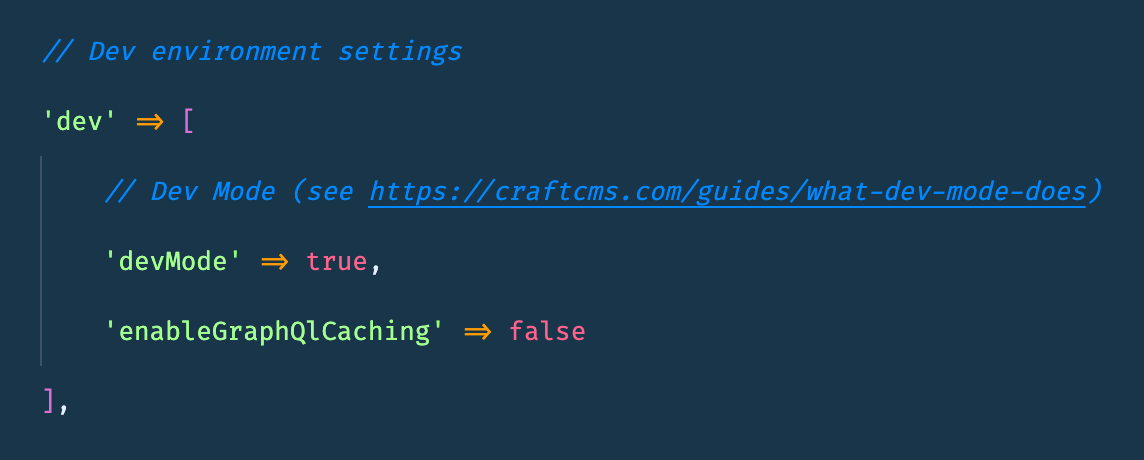
Huh. Can you try disabling GraphQL caching? (https://docs.craftcms.com/v3/config/config-settings.html#enablegraphqlcaching)
If that helps, then it would seem your caching engine is having some issues. That would explain why the first request is snappy (since there's nothing cached) but times out on subsequent requests.
 andris-sevcenko
on 31 Jan 2020
andris-sevcenko
on 31 Jan 2020
Hey @andris-sevcenko,
Thanks for getting back to me so fast.
I have set the variable in config and restarted the docker instance
But still getting 504s in both Postman

And our Gatsby build process

davebeesley
on 31 Jan 2020
@davebeesley that's really odd, because, if anything, 3.4 should have been faster.
Any chance you can spin this up on a site where I can get both CP and FTP/SSH access so I can see where the holdup is? If so, can you get in touch over [email protected] and reference this issue?
andris-sevcenko
on 31 Jan 2020
Morning @andris-sevcenko,
Apologies for things going quiet over the weekend. I'll check with my colleagues and see what we can sort out today, and email the details over when we I have them
davebeesley
on 3 Feb 2020
Thanks! I have a feeling that this will end up being an environmental issue, hence the request for direct access.
andris-sevcenko
on 3 Feb 2020
No worries. This project is quite firmly still in the development phase. So hasn't even ventured onto a staging site yet. It literally lives on docker instances on our developers machines (and I am the only one to have upgraded mine to 3.4). So we will have to setup a staging environment for you to access
davebeesley
on 3 Feb 2020
Out of curiosity. If one of your colleagues upgrades to 3.4, are they also experiencing the issue?
andris-sevcenko
on 3 Feb 2020
Hi @andris-sevcenko
Sorry for the radio silence. We have been working on the site back on 3.3 for the time being, to get us to a point we are confident we will hit a deadline.
We have now updated our staging site to 3.4.3, and all the associated plugins too, nothing is out of date.
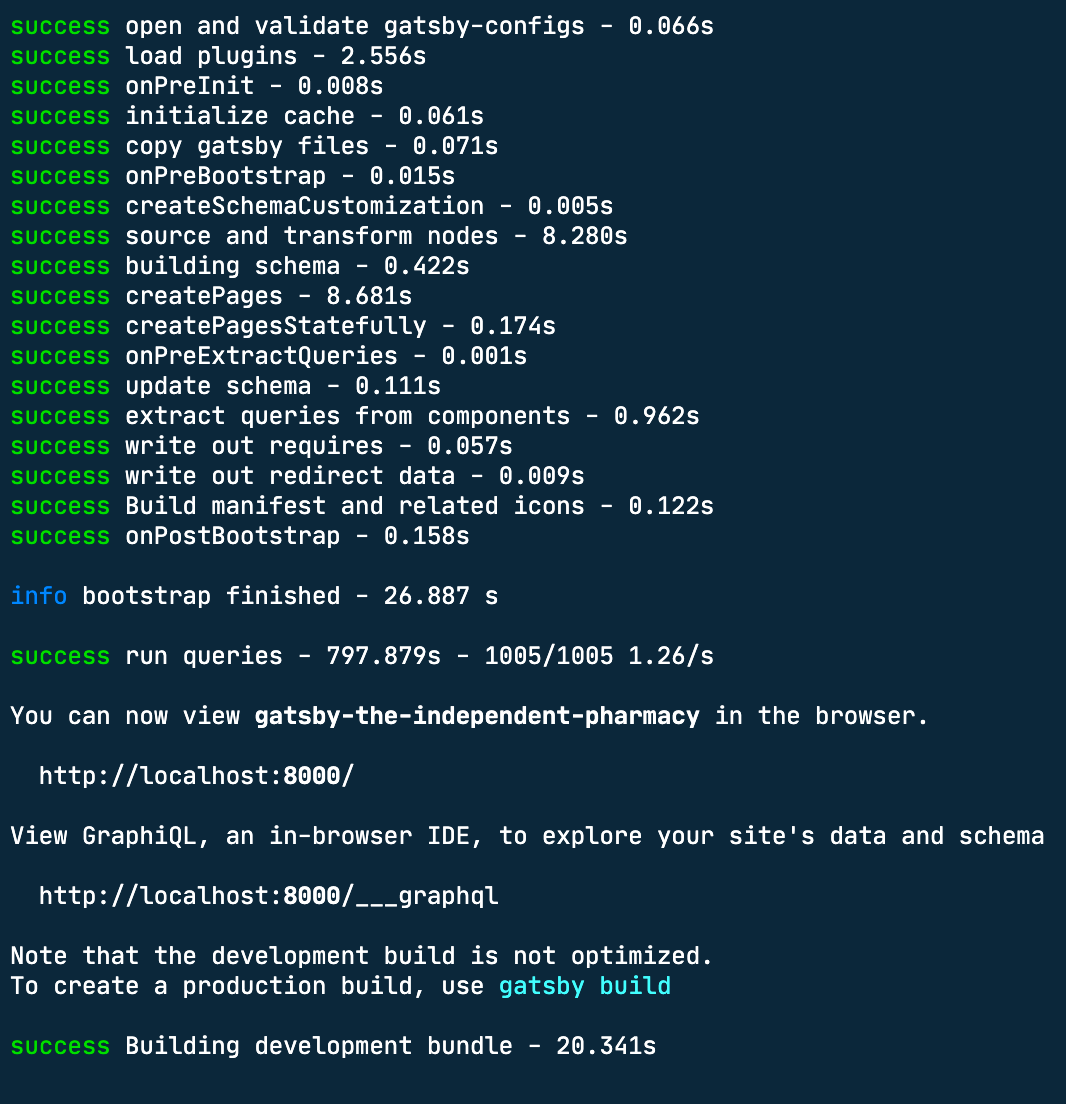
Previously, building Gatsby locally, from the GraphQL api on the staging site, took less than a minute when the staging site was on 3.3.20.1. Now it takes around 15-20 mins with GraphQL caching turned off.
I still also get the occasional 504, or as Gatsby interprets them
UNHANDLED REJECTION Unexpected token < in JSON at position 0
I think these are symptoms of the same issue, it was just more apparent on the underpowered Docker instance
davebeesley
on 4 Feb 2020
How long does it take with GraphQL caching turned on? The caching is pretty dumb in the way that it empties entirely the moment an element is saved or anything in site structure is changed, which, in this case, would also make it very reliable.
Do you have any metrics as far as the amount of GraphQL queries performed and the time they take?
andris-sevcenko
on 5 Feb 2020
Hey.
It's about the same so far, no noticeable decrease in time to compile that is.
Would that be logged in Craft? Or would I need to get Gatsby to output that for me?
davebeesley
on 5 Feb 2020
Maybe you could modify the vendor/craftcms/cms/src/controllers/GraphqlController::actionApi and make it log the incoming query time to a file and then send that file over?
Probably add
        $targetFile = Craft::$app->getPath()->getRuntimePath() . '/gql.log';
        $start = microtime(true);
to the start of the actionApi method and add
FileHelper::writeToFile($targetFile, '[' . (microtime(true) - $start) . '] ' . md5($query) . "\n", ['append' => true]);
RIGHT before the last line which returns the JSON result.
Then, run the build process ONCE. If you do it multiple times, make sure to delete the generated storage/runtime/gql.log before each run.
With that done, you'll have a file with each query fingerprinted with their execution times. Now, if you could do that on the same machine/setup but with Craft 3.3, we can start comparing the query counts and execution times. Does that sound like a plan that could work?
andris-sevcenko
on 5 Feb 2020
Hey @andris-sevcenko,
I am generating these logs for you now. Where would you like them submitted to?
davebeesley
on 6 Feb 2020
[email protected] would be excellent and make sure to reference this issue!
andris-sevcenko
on 6 Feb 2020
Sent. Hopefully GSuite hasn't stripped them out
davebeesley
on 6 Feb 2020
Got it all in one piece, thanks!
andris-sevcenko
on 6 Feb 2020
This has been fixed in Craft 3.4.5.
andris-sevcenko
on 17 Feb 2020
Hey @andris-sevcenko
I hope you don't mind me re-opening this but we have populated the craft instance with around 1000 entries now (after importing content from the old site)
With no caching, a Gatsby build on Netlify is taking around 20 mins and more often than not failing for some reason. Once a cache is built it only takes around 5 mins and the build on Netlify is successful.
The major problem is, it seems any content change busts the whole of the cache, so we can't reliably rebuild the site automatically or via a hook.
My boss did some profiling on the craft instance, it looks like it is doing around 1000 queries to generate the 1000 pages, but each query takes around a second. This seems awfully long
davebeesley
on 20 Feb 2020
Hey @davebeesley
Yeah, it's expected for the cache to operate like that. We considered adding a complex cache invalidating mechanism there to be a little over-the-top, so that's part of the reason why we added an event there, so any plugin can provide their own caching logic if they think they're up to the task.
As far as the profiling issue goes - the next step would be to take one of those queries in isolation and see if it takes a second without caching enabled. If it does, then it's probably worth profiling that further with something like https://blackfire.io/ to see what the hold up is. If it does not, then it's probably worth looking into cumulative loads and what starts slowing down once the build process starts.
andris-sevcenko
on 21 Feb 2020
@davebeesley any updates on this?
andris-sevcenko
on 25 Feb 2020
We haven't done any profiling as far as I am aware. I have handed this off to my boss to organise. I'll let you know when he has something for you
davebeesley
on 26 Feb 2020
Morning @andris-sevcenko
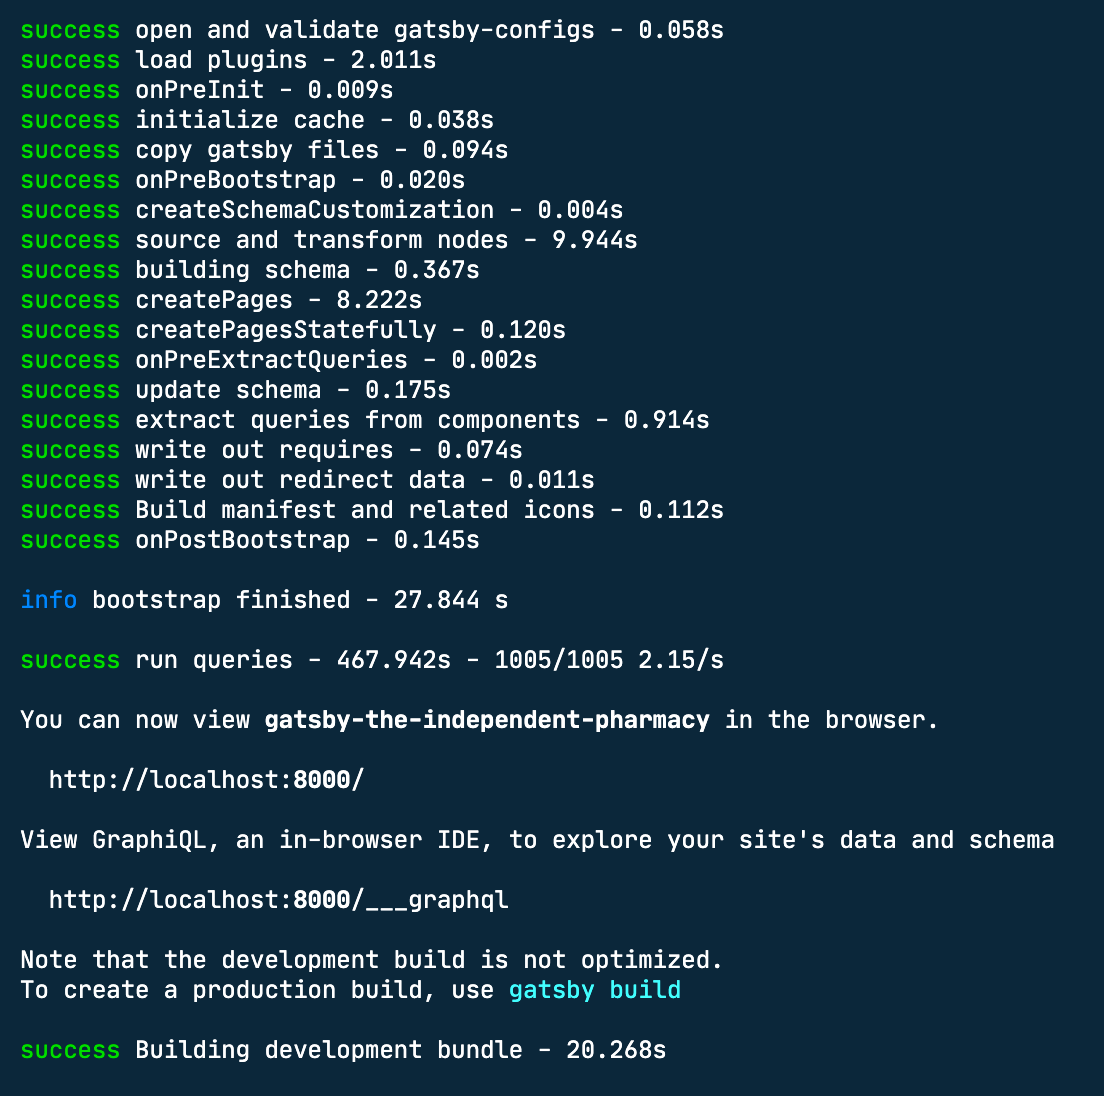
We are still working on profiling, but we have updated our staging site to 3.4.8 this morning after seeing some release notes implying faster indexing.
With 1000 pages, fully updated and clear caches a full Gatsby build take 40 mins, which is double the previous time.
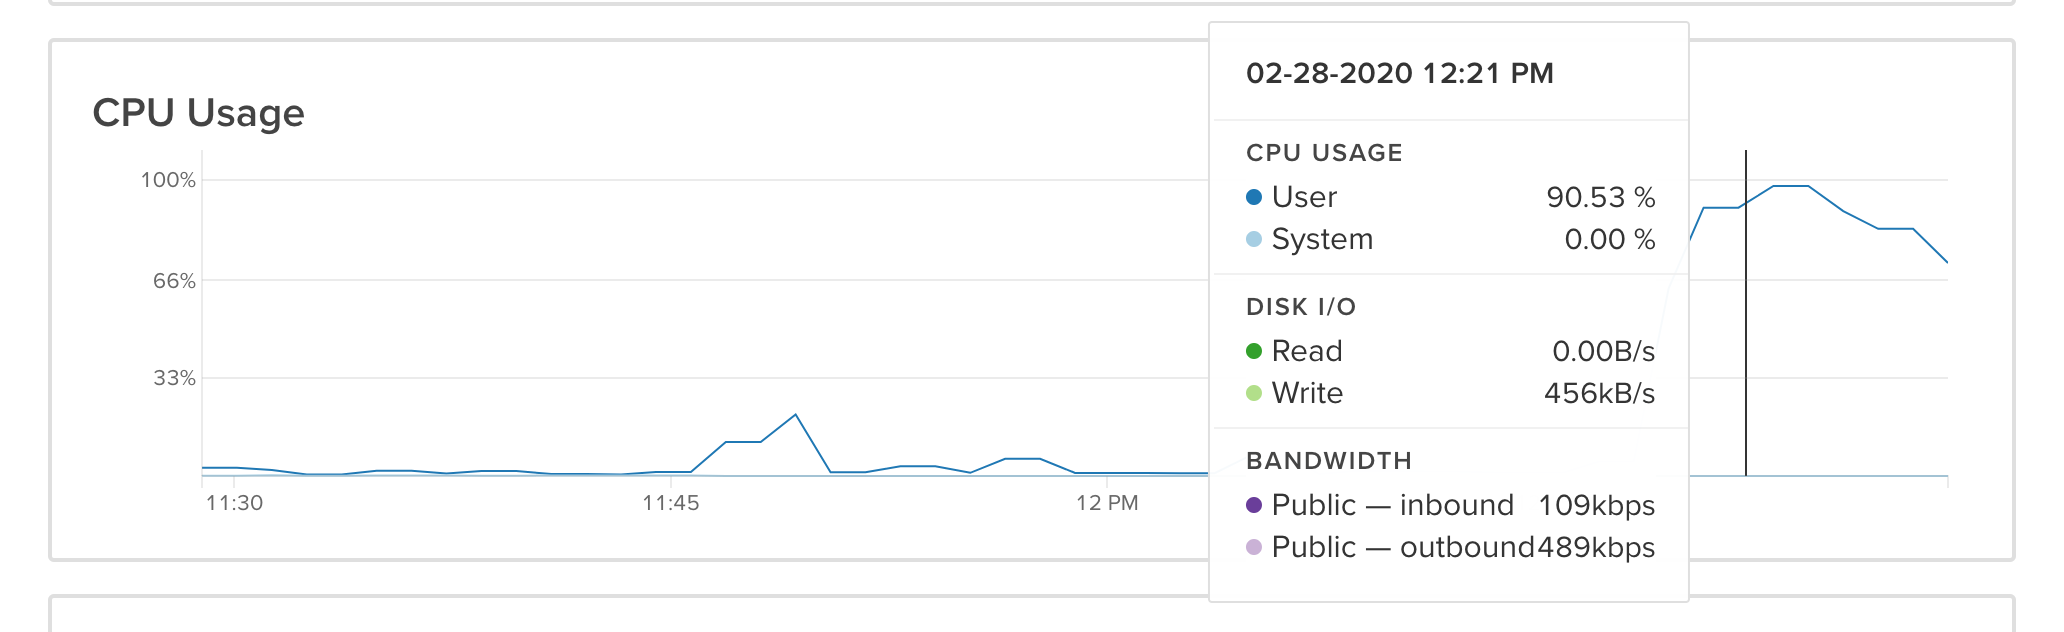
Also, while we are requesting content via the GraphQL instance, the server instance is at 100% CPU load for the whole time.
Whilst we identified that our Docker instance was timing out during a build, we are going to attempt a local instance of this via MAMP to see if that is any quicker and if we can use that for profiling. I'll let you know how we get on
davebeesley
on 27 Feb 2020
Hi @andris-sevcenko
So we have made a discovery.
Running off of MAMP, with 100% of my laptop resources available (2.3 GHz Dual-Core Intel Core i5, 16 GB 2133 MHz LPDDR3) the build completes in 153s (less than 3 mins)
Compare that to when we build from our runcloud/DigitalOcean instance (Intel(R) Xeon(R) CPU E5-2650L v3 @ 1.80GHz, 4GB RAM) where builds are taking between 20 and 40m min
And my local Docker instance (2 Cores, 6Gb) timing out 504 regularly
It definitely looks like we are bouncing off of system limitations. So the pauses between queries are caused it waiting for system resources.
Any thoughts on how we can improve this?
davebeesley
on 27 Feb 2020
Hi @andris-sevcenko
Another update for you. We migrated the Craft instance to a dedicated DigitalOcean droplet (no RunCloud) - we chose a "CPU Optimised" Droplet - 2 Cores, 4Gb
Once up and running, we ran a full Gatsby develop run with no Cache on Craft - this took around 900 seconds, and the CPU usage was regularly topping out on the droplet.
We are now trying bumping the droplet up to 4 cores and 8GB Ram
davebeesley
on 28 Feb 2020
FYI we are on Craft 3.4.8 now
davebeesley
on 28 Feb 2020
@andris-sevcenko
The 4 core and 8Gb RAM instance delivered all the content in around 500 seconds. So it defintely improves with brute force. But this will be far too costly for our client.
Thinking outside the box here. If our queries include requests for images, could we be triggering image creation via GD/ImageMagick? Could that be what is topping out our CPU?
davebeesley
on 28 Feb 2020
@davebeesley That's totally possible. Are you using transforms?
andris-sevcenko
on 28 Feb 2020
We are. But we are also using s3 hosting. We aren't pulling the images into gatsby, just a url from Craft
davebeesley
on 28 Feb 2020
fragment treatmentFeaturedImage on CraftCMS_treatmentImages_Asset {
        id
        url(transform: "thumbnail")
        path
}
If you're not eager-loading those thumbnails, you're gonna be executing an extra DB query for each asset - https://docs.craftcms.com/v3/dev/eager-loading-elements.html#eager-loading-image-transform-indexes
Luckily, Craft 3.4.8 that shipped a week ago supports the withTransforms argument on Asset fields. Can you try adding that to see if that helps at all?
andris-sevcenko
on 28 Feb 2020
Cool. I will rework our queries this afternoon and try again
davebeesley
on 28 Feb 2020
@andris-sevcenko Is withTransforms not available on user > photo?
davebeesley
on 28 Feb 2020
@davebeesley It _should_ be, but it might be treated differently since it's sort of a constructed field. I'll have to look into that. Did you have any luck applying withTransforms to other places and did that help?
andris-sevcenko
on 28 Feb 2020
Just doing a recompile now. We were relying on photo in a lot of places, which doesn't seem to have withTransforms exposed
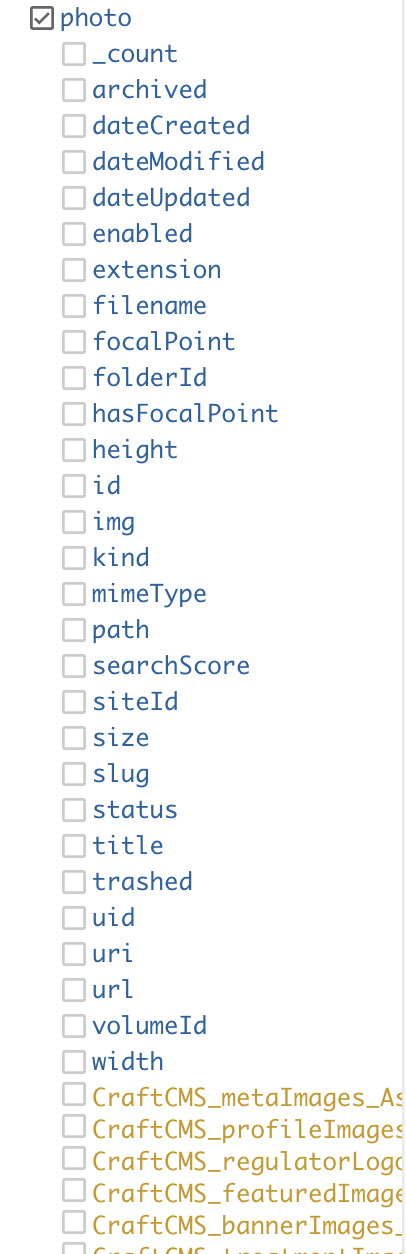
So I have removed those for now
davebeesley
on 28 Feb 2020
Alright. Let me know if that was the culprit and we'll see about optimizing that part.
andris-sevcenko
on 28 Feb 2020
So we have switched the photos to use a normal asset field. So we are still obtaining the same amount of images as before.
We upped the machine specs to 8 cores and 16gb and implemented this, and the build dropped to ~450s About 8 mins. We were only ever hitting 50% CPU this time.
We are going to revert to the server specs we were using originally, see if we are topping out the CPU anymore. (2 Cores, 4Gb)
davebeesley
on 28 Feb 2020
If you guys could profile it using Blackfire or similar, that would also help a lot :)
andris-sevcenko
on 28 Feb 2020
Cool. We will look into that. Blackfire is quite pricey, could you recommend an alternative?
I am working on implementing as much eager loading in our queries as possible. Is eager loading of content a possibility?
davebeesley
on 28 Feb 2020
@andris-sevcenko Is eager loading possible across entries fields? Say we were pulling in related blog posts into a product page? Or is this done automatically?
Could this be another bottleneck?
davebeesley
on 28 Feb 2020
Sorry, I didn't answer your previous question
Eager loading image transforms doesn't seem to have sped anything up. And only new images have been added to our s3 buckets, not a complete regeneration of images. So I assume images aren't being reprocessed on build
davebeesley
on 28 Feb 2020
Hi @andris-sevcenko, thanks for your help so far, did you have any advice for profiling with blackfire?
As far as I can tell you only profile requests on-demand, so something like a build process cannot be profiled?
 phillipdaviesdeveloper
on 28 Feb 2020
phillipdaviesdeveloper
on 28 Feb 2020
We have instead installed datadog and now have a full trace of Yii as well as the server resources and MySQL database usage.
I can probably give you access if you would like to take a look?
phillipdaviesdeveloper
on 28 Feb 2020
As far as I can tell you only profile requests on-demand, so something like a build process cannot be profiled?
Yeah, you're right. Probably not the best route to go, here..
I can probably give you access if you would like to take a look?
That would be amazing, @phillipdaviesdeveloper! Can you shoot that over to [email protected] and reference this issue?
andris-sevcenko
on 28 Feb 2020
@davebeesley sorry for late interruption, but caught your comment on Blackfire pricing, and had a look, because I've always used (their simply excellent , easy to implement tool) for free...
Have a look at the SAAS plan, under the priced ones on this page. It's free, has some restrictions which can't remember if were the same -- short retention was there, local machine not sure because that's where I've run it, and maybe you can do the same...
 narration-sd
on 28 Feb 2020
narration-sd
on 28 Feb 2020
Hey @andris-sevcenko, sorry for the delay, I had left the office for the day!
I have sent [email protected] an invitation to view our datadog account.
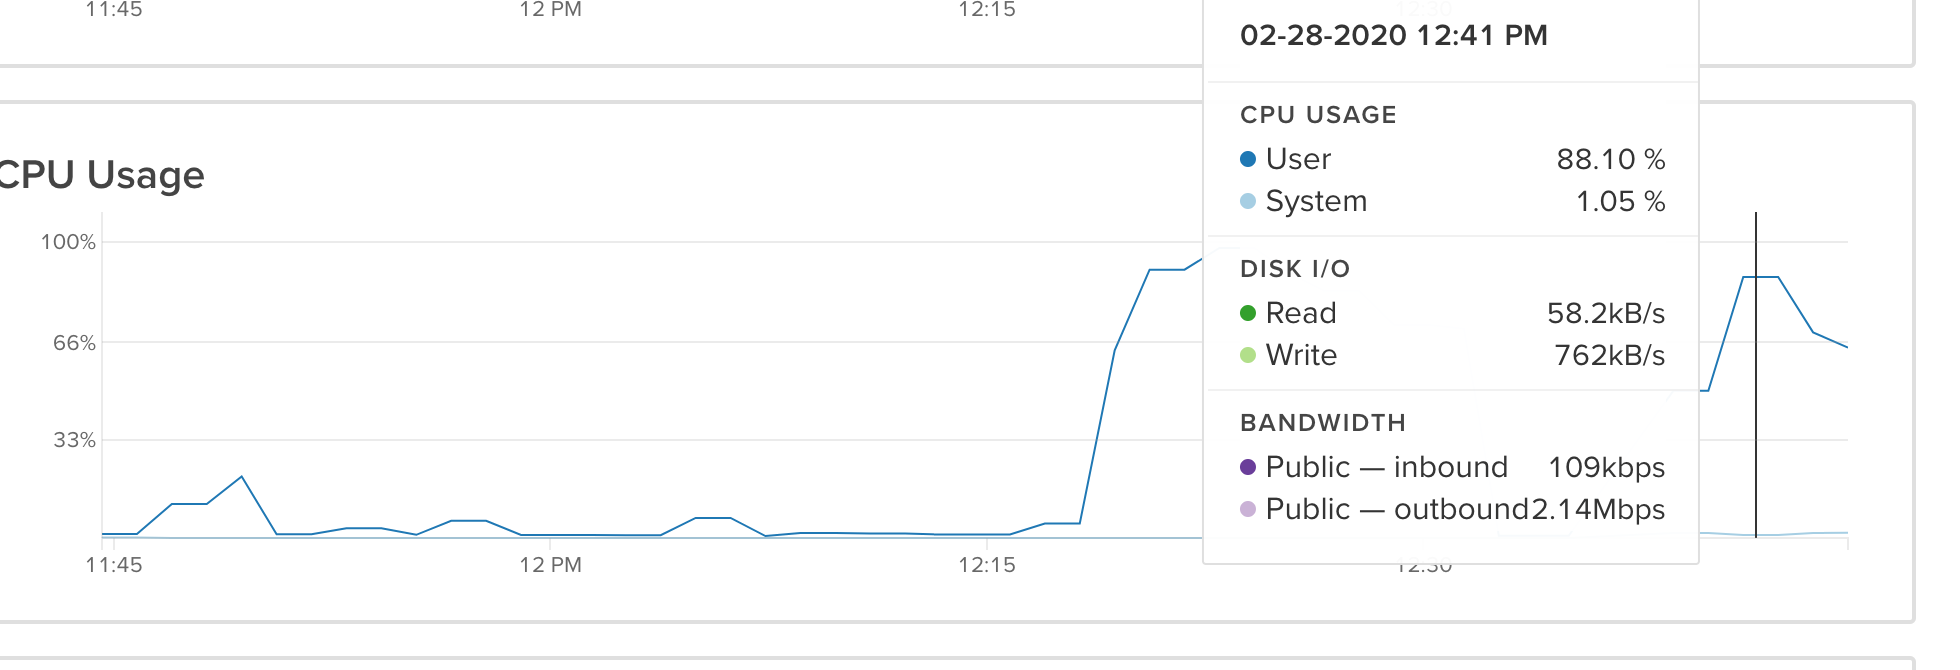
The last build was around 7:20pm (GMT) on Friday ending at about 7:41pm, you can see on the dashboard where CPU usage hits close to 100% for the bulk of the build process.
If you view the traces under
APM -> Traces
you can see the PDO and Yii information. If you scope the traces to:
- min duration: 8.5 seconds
- service: Yii
You can see where the issue is as we are getting around 60 requests taking 20 seconds each to respond. This is mainly due to Yii's time to complete the response to the graphAPI request, which is likely due to the CPU being maxed out (memory, PDO response times and read/write all look to be fine).
FYI - This build was done on the smaller CPU optimised instance (2 Cores, 4Gb RAM)
Hopefully, this information will help, let me know if you need anything else and thanks for looking into it.
phillipdaviesdeveloper
on 29 Feb 2020
@phillipdaviesdeveloper I followed up with @davebeesley via email!
andris-sevcenko
on 2 Mar 2020
This has been resolved long since over support email.
andris-sevcenko
on 23 Nov 2020
Related issues
 rynpsc
·
3Comments
rynpsc
·
3Comments
 darylknight
·
3Comments
darylknight
·
3Comments
 brandonkelly
·
3Comments
brandonkelly
·
3Comments
 mattstein
·
3Comments
mattstein
·
3Comments
 benface
·
3Comments
benface
·
3Comments