Cloud-on-k8s: [1.4.0] After a while, master nodes can't join the cluster anymore
Bug Report
What did you do?
Initialized new clusters with 1.4.0.
What did you see instead? Under which circumstances?
After a while (~ a few days), a couple of my clusters randomly start to get an unknown status. Please note I currently have 10 different Elasticsearch clusters, and this happens randomly only a few of them.
I tried to remove the cluster & recreate another one. It works but after a few days another one is having the same issue.
Masters are returning some errors: SERVICE_UNAVAILABLE/1/state not recovered / initialized & MasterNotDiscoveredException.
master not discovered yet, this node has not previously joined a bootstrapped (v7+) cluster, and [cluster.initial_master_nodes] is empty on this node: have discovered
What I tried to do
I managed to restart the master nodes by applying this to them
      cluster.initial_master_nodes:
        - elasticsearch-es-master-0
        - elasticsearch-es-master-1
        - elasticsearch-es-master-2
And restart them manually. It then started the cluster with a new id so it was not a proper solution...
Environment
ECK version: 1.4.0 (note that I've been using ECK 1.2.0 WITHOUT any issue). I never tried 1.3.0. And created new clusters from scratch after upgrade ECK to 1.4.0.
Kubernetes information:
Cloud : Gke 1.18.15-gke.1500
- Resource definition:
apiVersion: elasticsearch.k8s.elastic.co/v1
kind: Elasticsearch
spec:
  auth:
    fileRealm:
      - secretName: realm
  http:
    service:
      metadata:
        creationTimestamp: null
      spec: {}
    tls:
      certificate: {}
      selfSignedCertificate:
        disabled: true
  image: 'oceanpublic/elasticsearch:7.10.2-r1'
  nodeSets:
    - config:
        node.data: false
        node.ingest: false
        node.master: true
      count: 3
      name: master
      podTemplate:
        spec:
          affinity:
            podAntiAffinity:
              preferredDuringSchedulingIgnoredDuringExecution:
                - podAffinityTerm:
                    labelSelector:
                      matchLabels:
                        common.k8s.elastic.co/type: elasticsearch
                    topologyKey: kubernetes.io/hostname
                  weight: 100
          containers:
            - command:
                - elasticsearch_exporter
                - >-
                  --es.uri=http://127.0.0.1:9200
                - '--es.all'
                - '--es.indices'
                - '--es.indices_settings'
                - '--es.shards'
                - '--es.snapshots'
                - '--es.timeout=30s'
                - '--web.listen-address=:9108'
                - '--web.telemetry-path=/metrics'
              image: 'justwatch/elasticsearch_exporter:1.1.0'
              livenessProbe:
                httpGet:
                  path: /
                  port: 9108
                  scheme: HTTP
              name: elasticsearch-exporter
              ports:
                - containerPort: 9108
                  name: http
                  protocol: TCP
              readinessProbe:
                httpGet:
                  path: /
                  port: 9108
                  scheme: HTTP
            - env:
                - name: ES_JAVA_OPTS
                  value: '-Xms1g -Xmx1g'
              name: elasticsearch
              resources:
                limits:
                  cpu: '4'
                  memory: 2Gi
                requests:
                  cpu: '1'
                  memory: 2Gi
          initContainers:
            - command:
                - sh
                - '-c'
                - sysctl -w vm.max_map_count=262144
              name: sysctl
              securityContext:
                privileged: true
          nodeSelector:
            preemptible: 'true'
          priorityClassName: critical
      volumeClaimTemplates:
        - metadata:
            name: elasticsearch-master
          spec:
            accessModes:
              - ReadWriteOnce
            resources:
              requests:
                storage: 1Gi
            storageClassName: standard
    - config:
        node.data: true
        node.ingest: true
        node.master: false
      count: 4
      name: data2
      podTemplate:
        spec:
          affinity:
            podAntiAffinity:
              preferredDuringSchedulingIgnoredDuringExecution:
                - podAffinityTerm:
                    labelSelector:
                      matchLabels:
                        common.k8s.elastic.co/type: elasticsearch
                    topologyKey: kubernetes.io/hostname
                  weight: 100
          containers:
            - env:
                - name: ES_JAVA_OPTS
                  value: '-Xms1g -Xmx1g'
              name: elasticsearch
              resources:
                limits:
                  cpu: '4'
                  memory: 2Gi
                requests:
                  cpu: '1'
                  memory: 2Gi
          initContainers:
            - command:
                - sh
                - '-c'
                - sysctl -w vm.max_map_count=262144
              name: sysctl
              securityContext:
                privileged: true
          nodeSelector:
            preemptible: 'true'
          priorityClassName: critical
      volumeClaimTemplates:
        - metadata:
            name: elasticsearch-data
          spec:
            accessModes:
              - ReadWriteOnce
            resources:
              requests:
                storage: 400Gi
            storageClassName: standard
  secureSettings:
    - secretName: gcs-credentials
  version: 7.10.2
 Mokto
Mokto
All 10 comments
In an earlier version of your post you had an additional init container in your Elasticsearch manifest which ran the elasticsearch-node detach-cluster tool.
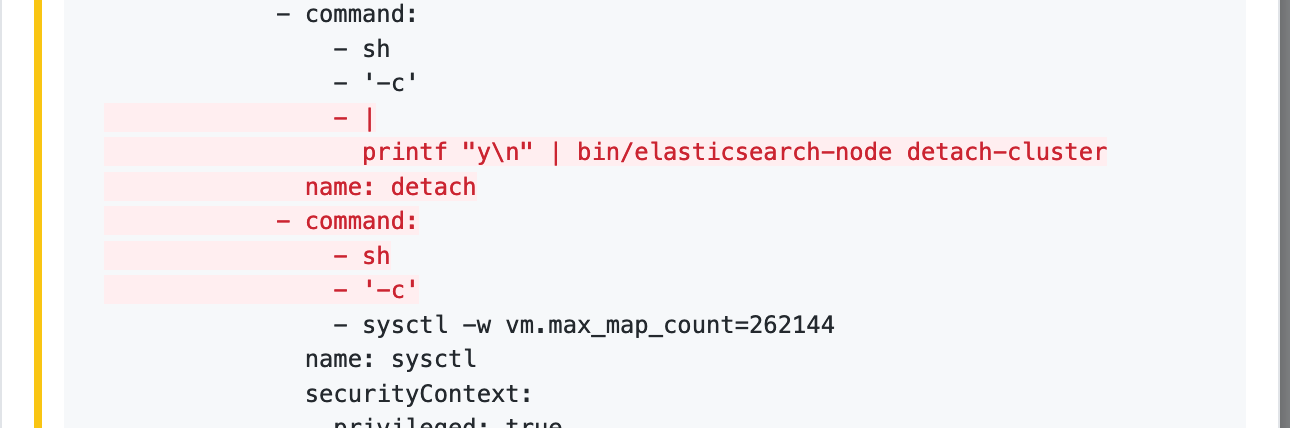
The effects of running this tool would be consistent with what you described: master-eligible nodes would detach from the cluster and you would see the master not discovered yet, this node has not previously joined a bootstrapped (v7+) cluster, and [cluster.initial_master_nodes] is empty on this node: have discovered message in the logs.
You should never run this tool unless in a disaster recovery scenario. Using it in an init container is particularly problematic as init containers will be run every time a Pod restarts.
 pebrc
on 1 Mar 2021
pebrc
on 1 Mar 2021
1) Those were only applied to data nodes
2) That's what I used to restore the data nodes, because they couldn't join the cluster anymore (because different cluster id)
So the manifest that I shared is the right one that is crashing.
Mokto
on 1 Mar 2021
Sorry for I closed the issue by mistake.
Mokto
on 1 Mar 2021
One thing I noticed:
 volumeClaimTemplates:
        - metadata:
            name: elasticsearch-master
          spec:
            accessModes:
              - ReadWriteOnce
            resources:
              requests:
                storage: 1Gi
            storageClassName: standard
The volume claim template for all nodes, including master nodes, must be called elasticsearch-data. What happens here is that ECK creates a default elasticsearch-data 1GB volume claim for you (since you don't specify it), and does not specify a storage class, so the default one gets used.
Here your elasticsearch-master claim is basically created but unused, since the default elasticsearch-data is used instead.
Could the default storage class on your cluster point to a type of volume where data isn't properly persisted?
(Naming can indeed be confusing, elasticsearch-data is meant as "the data folder of Elasticsearch", and not "the content of data nodes").
 sebgl
on 1 Mar 2021
sebgl
on 1 Mar 2021
Thanks for your answers @sebgl, @pebrc !
I didn't know about that. I'll change that at some point, but as there is no easy way to do that (without resetting the whole cluster, & restore a snapshot), it might take a while.
But I don't think it's the issue, because:
1) My default storage class is persistent
2) I'm using almost only preemptible instances, which means their lifespan is max 24h.
- I would have had a lot of issues before
- the issue can appear after several days
- some clusters have been running for a week without any issue
But if you still believe that could be an issue, I'm definitely willing to give it a try quickly ?
Mokto
on 1 Mar 2021
Seeing master not discovered yet, this node has not previously joined a bootstrapped (v7+) cluster, and [cluster.initial_master_nodes] is empty on this node: have discovered in the logs of master nodes definitely seems to indicate there was data loss on those master nodes: they cannot infer from their existing data that they were part of a cluster.
Is there a chance your PVCs were recreated at some point? You could look at the master nodes PVC & PV creation timestamp, and check whether that matches the master node data loss event.
sebgl
on 1 Mar 2021
kubectl get elasticsearch -n jaeger
kubectl get pvc -n jaeger
kubectl get pv -n jaeger
All return the same creation date.
On both clusters that became "unknown".
I can also try to rollback to 1.3.2, see if that changes anything.
Mokto
on 1 Mar 2021
I can also try to rollback to 1.3.2, see if that changes anything.
Going back to a previous version is not supported (unless you recreate all your workloads). You can only go forwards.
pebrc
on 1 Mar 2021
Ok, good to know, I wanted to make sure before trying. Thanks!
I'm a bit out of ideas right now.
I guess I'll recreate my clusters (+restore data) and monitor more closely to see if I can get more information for next time ?
Mokto
on 1 Mar 2021
Closing due to inactivity. Feel free to reopen if needed.
 thbkrkr
on 13 Apr 2021
thbkrkr
on 13 Apr 2021
Related issues
sebgl
·
3Comments
pebrc
·
3Comments
sebgl
·
3Comments
sebgl
·
5Comments
 SebastianCaceresUltra
·
3Comments
SebastianCaceresUltra
·
3Comments
Most helpful comment
One thing I noticed:
The volume claim template for all nodes, including master nodes, must be called
elasticsearch-data. What happens here is that ECK creates a defaultelasticsearch-data1GB volume claim for you (since you don't specify it), and does not specify a storage class, so the default one gets used.Here your
elasticsearch-masterclaim is basically created but unused, since the defaultelasticsearch-datais used instead.Could the default storage class on your cluster point to a type of volume where data isn't properly persisted?
(Naming can indeed be confusing,
elasticsearch-datais meant as "the data folder of Elasticsearch", and not "the content of data nodes").