cloud-on-k8s-e2e-tests-ocp unstable
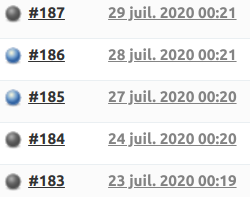
Since build # 183 (23 juil. 2020 00:19:59), we had 3 times the job aborted after 10h (600 minutes, the job timeout).
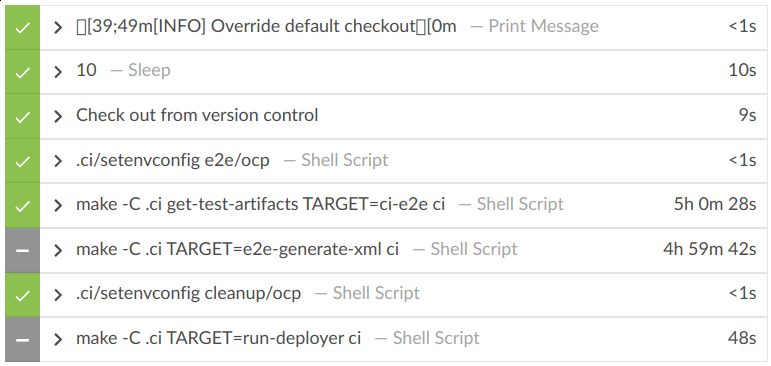
The make -C .ci TARGET=e2e-generate-xml ci stage is blocked and times out. Normally, this stage takes 2 seconds.
Log of a failed run:
[2020-07-29T05:25:21.868Z] + make -C .ci TARGET=e2e-generate-xml ci
[2020-07-29T05:25:21.868Z] make: Entering directory '/var/lib/jenkins/workspace/cloud-on-k8s-e2e-tests-ocp/.ci'
[2020-07-29T05:25:21.868Z] make[1]: Entering directory '/var/lib/jenkins/workspace/cloud-on-k8s-e2e-tests-ocp/.ci'
[2020-07-29T05:25:22.917Z] docker.elastic.co/eck-ci/eck-ci-tools:e514e78a
[2020-07-29T05:25:23.880Z] ✓  test/e2e (15m25.855s)
[2020-07-29T05:25:23.880Z] ✓  test/e2e/apm (11m37.496s)
[2020-07-29T05:25:23.880Z] ✓  test/e2e/beat (25m6.075s)
[2020-07-29T05:25:23.880Z] ∅  test/e2e/cmd
[2020-07-29T05:25:23.880Z] ✓  test/e2e/cmd/run (26ms)
[2020-07-29T05:25:23.880Z] ✓  test/e2e/ent (17m56.864s)
// >>>>> The job is blocked here <<<<<
[2020-07-29T10:24:52.239Z] Sending interrupt signal to process
[2020-07-29T10:25:02.432Z] make: *** [Makefile:400: e2e-generate-xml] Terminated
[2020-07-29T10:25:02.432Z] Makefile:45: recipe for target 'ci-internal' failed
[2020-07-29T10:25:02.432Z] make[1]: *** [ci-internal] Terminated
[2020-07-29T10:25:02.432Z] make[1]: Leaving directory '/var/lib/jenkins/workspace/cloud-on-k8s-e2e-tests-ocp/.ci'
[2020-07-29T10:25:02.432Z] Makefile:39: recipe for target 'ci' failed
[2020-07-29T10:25:02.433Z] make: *** [ci] Error 2
[2020-07-29T10:25:02.433Z] make: Leaving directory '/var/lib/jenkins/workspace/cloud-on-k8s-e2e-tests-ocp/.ci'
[2020-07-29T10:25:02.442Z] script returned exit code 2
Log of a successful run:
[2020-07-28T05:29:17.524Z] + make -C .ci TARGET=e2e-generate-xml ci
[2020-07-28T05:29:17.524Z] make: Entering directory '/var/lib/jenkins/workspace/cloud-on-k8s-e2e-tests-ocp/.ci'
[2020-07-28T05:29:17.524Z] make[1]: Entering directory '/var/lib/jenkins/workspace/cloud-on-k8s-e2e-tests-ocp/.ci'
[2020-07-28T05:29:18.479Z] docker.elastic.co/eck-ci/eck-ci-tools:e514e78a
[2020-07-28T05:29:19.427Z] ✓  test/e2e (16m1.173s)
[2020-07-28T05:29:19.427Z] ✓  test/e2e/apm (11m15.675s)
[2020-07-28T05:29:19.427Z] ✓  test/e2e/beat (24m49.085s)
[2020-07-28T05:29:19.427Z] ∅  test/e2e/cmd
[2020-07-28T05:29:19.427Z] ✓  test/e2e/cmd/run (27ms)
[2020-07-28T05:29:19.427Z] ✓  test/e2e/ent (17m8.114s)
[2020-07-28T05:29:19.427Z] ✓  test/e2e/es (2h30m55.16s)
[2020-07-28T05:29:19.427Z] ✓  test/e2e/kb (26m25.537s)
[2020-07-28T05:29:19.427Z] ✓  test/e2e/test (23ms)
[2020-07-28T05:29:19.427Z] ∅  test/e2e/test/apmserver
[2020-07-28T05:29:19.427Z] ∅  test/e2e/test/beat
[2020-07-28T05:29:19.427Z] ∅  test/e2e/test/command
[2020-07-28T05:29:19.427Z] ✓  test/e2e/test/elasticsearch (24ms)
[2020-07-28T05:29:19.427Z] ∅  test/e2e/test/enterprisesearch
[2020-07-28T05:29:19.427Z] ∅  test/e2e/test/helper
[2020-07-28T05:29:19.427Z] ∅  test/e2e/test/kibana
[2020-07-28T05:29:19.427Z]
[2020-07-28T05:29:19.427Z] === Skipped
[2020-07-28T05:29:19.427Z] === SKIP: test/e2e/beat TestFilebeatNoAutodiscoverRecipe (0.00s)
[2020-07-28T05:29:19.427Z]
[2020-07-28T05:29:19.427Z] === SKIP: test/e2e/beat TestFilebeatAutodiscoverRecipe (0.00s)
[2020-07-28T05:29:19.427Z]
[2020-07-28T05:29:19.427Z] === SKIP: test/e2e/beat TestFilebeatAutodiscoverByMetadataRecipe (0.00s)
[2020-07-28T05:29:19.427Z]
[2020-07-28T05:29:19.427Z] === SKIP: test/e2e/beat TestMetricbeatHostsRecipe (0.00s)
[2020-07-28T05:29:19.427Z]
[2020-07-28T05:29:19.427Z] === SKIP: test/e2e/beat TestMetricbeatStackMonitoringRecipe (0.00s)
[2020-07-28T05:29:19.427Z]
[2020-07-28T05:29:19.427Z] === SKIP: test/e2e/beat TestHeartbeatEsKbHealthRecipe (0.00s)
[2020-07-28T05:29:19.427Z]
[2020-07-28T05:29:19.427Z] === SKIP: test/e2e/beat TestAuditbeatHostsRecipe (0.00s)
[2020-07-28T05:29:19.427Z]
[2020-07-28T05:29:19.427Z] === SKIP: test/e2e/beat TestPacketbeatDnsHttpRecipe (0.00s)
[2020-07-28T05:29:19.427Z]
[2020-07-28T05:29:19.427Z] === SKIP: test/e2e/beat TestJournalbeatHostsRecipe (0.00s)
[2020-07-28T05:29:19.427Z]
[2020-07-28T05:29:19.427Z] === SKIP: test/e2e/ent TestEnterpriseSearchVersionUpgradeToLatest7x (0.00s)
[2020-07-28T05:29:19.427Z]
[2020-07-28T05:29:19.427Z] === SKIP: test/e2e/es TestEnterpriseTrialExtension (0.00s)
[2020-07-28T05:29:19.427Z]
[2020-07-28T05:29:19.427Z] === SKIP: test/e2e/es TestPodTemplateValidation (0.00s)
[2020-07-28T05:29:19.427Z]
[2020-07-28T05:29:19.427Z] === SKIP: test/e2e/es TestVersionUpgradeSingleToLatest7x (0.00s)
[2020-07-28T05:29:19.427Z]
[2020-07-28T05:29:19.427Z] === SKIP: test/e2e/es TestVersionUpgradeTwoNodesToLatest7x (0.00s)
[2020-07-28T05:29:19.427Z]
[2020-07-28T05:29:19.427Z] === SKIP: test/e2e/kb TestVersionUpgradeToLatest7x (0.00s)
[2020-07-28T05:29:19.427Z]
[2020-07-28T05:29:19.427Z] === SKIP: test/e2e/kb TestVersionUpgradeAndRespecToLatest7x (0.00s)
[2020-07-28T05:29:19.427Z]
[2020-07-28T05:29:19.427Z]
[2020-07-28T05:29:19.427Z] DONE 3562 tests, 16 skipped in 0.175s
[2020-07-28T05:29:19.427Z] make[1]: Leaving directory '/var/lib/jenkins/workspace/cloud-on-k8s-e2e-tests-ocp/.ci'
[2020-07-28T05:29:19.427Z] make: Leaving directory '/var/lib/jenkins/workspace/cloud-on-k8s-e2e-tests-ocp/.ci'
e2e-generate-xml uses the e2e-tests.json file to generate an XML report.
https://github.com/elastic/cloud-on-k8s/blob/6be658ee4883dffa31355ea5cd8b3bb5d4698541/Makefile#L399-L400
Maybe related to #3499.
 thbkrkr
All 20 comments
😢
I think it can happen when e2e-tests.json contains malformed content. I observed it locally while playing with gotestsum --junitfile e2e-tests.xml --raw-command cat e2e-tests.json: the command got stuck.
However I cannot reproduce it anymore, I don't remember the exact content I had there :/
It could help to print the content of e2e-tests.json temporarily before we run the gotestsum command so we get more details? (i.e. adapt https://github.com/elastic/cloud-on-k8s/pull/3480)
 sebgl
on 29 Jul 2020
sebgl
on 29 Jul 2020
Ah, I can actually reproduce locally by running gotestsum --junitfile e2e-tests.xml --raw-command cat e2e-tests.json with e2e-tests.json forged from https://devops-ci.elastic.co/blue/rest/organizations/jenkins/pipelines/cloud-on-k8s-e2e-tests-ocp/runs/187/nodes/23/steps/27/log/?start=0.
Now trying to figure out what's wrong in this file.
sebgl
on 29 Jul 2020
Hah, found the culprit log line:
{"Time":"2020-07-29T04:34:59.62020-07-29T04:34:59.615909289Z 15460647Z","Action":"pass","Package":"github.com/elastic/cloud-on-k8s/test/e2e/es","Test":"TestRiskyMasterReconfiguration/Add_some_data_to_the_cluster_before_any_mutation","Elapsed":1.32}
Remove this line and the command succeeds.
Where does this weird date come from?
sebgl
on 29 Jul 2020
2020-07-29T04:34:59.62020-07-29T04:34:59.615909289Z 15460647Z
Looks like there's a date inserted right after the 2020-07-29T04:34:59.6 so should be:
2020-07-29T04:34:59.615460647Z
2020-07-29T04:34:59.615909289Z
I was wondering if it was a stream interruption or something, but it's about 3h33m from when we start streaming logs which doesn't strike me as out of place. But whyyyy
 anyasabo
on 29 Jul 2020
anyasabo
on 29 Jul 2020
Same for all failed executions:
> grep '"Time":"[^"]*\s[^"]*"' 18*.logs.txt
183.logs.txt:[2020-07-23T04:37:14.507Z] {"Time":"2020-07-23T04:32020-07-23T04:37:11.781908685Z 7:11.781851012Z","Action":"output","Package":"github.com/elastic/cloud-on-k8s/test/e2e/es","Test":"TestVersionUpgradeSingleMaster68xToNewNodeSet7x/Deleting_Elasticsearch_should_return_no_error","Output":"    --- PASS: TestVersionUpgradeSingleMaster68xToNewNodeSet7x/Deleting_Elasticsearch_should_return_no_error (0.01s)\n"}
184.logs.txt:[2020-07-24T04:29:34.760Z] {"Time":"2020-07-24T04:29:292020-07-24T04:29:29.050014089Z .049848103Z","Action":"pass","Package":"github.com/elastic/cloud-on-k8s/test/e2e/es","Test":"TestRiskyMasterReconfiguration/Add_some_data_to_the_cluster_before_any_mutation","Elapsed":1.51}
187.logs.txt:[2020-07-29T04:35:01.678Z] {"Time":"2020-07-29T04:34:59.62020-07-29T04:34:59.615909289Z 15460647Z","Action":"pass","Package":"github.com/elastic/cloud-on-k8s/test/e2e/es","Test":"TestRiskyMasterReconfiguration/Add_some_data_to_the_cluster_before_any_mutation","Elapsed":1.32}
188.logs.txt:[2020-07-30T03:46:18.623Z] {"Time":"2020-07-30T03:46:13.72020-07-30T03:46:13.739790391Z 39484576Z","Action":"pass","Package":"github.com/elastic/cloud-on-k8s/test/e2e/es","Test":"TestMutationRollingDownscaleCombination","Elapsed":178.05}
It's not always the same test (TestVersionUpgradeSingleMaster68xToNewNodeSet7x, TestRiskyMasterReconfiguration, TestMutationRollingDownscaleCombination) or the same action (pass or output). The two timestamps are not exactly mixed at the same position (16, 20, 22).
Maybe a coincidence, 3 times (not in # 184), the inserted timestamp matches a time that is just before a Throttling request took... log.
# 183
{"Time":"2020-07-23T04:37:12.832400609Z","Action":"output","Test":"TestVersionUpgradeSingleMaster68xToMore7x",
 "Output":"I0723 04:37:12.832285   12488 request.go:621] Throttling request took 1.047201073s,
  request: GET:https://172.30.0.1:443/apis/cloudcredential.openshift.io/v1?timeout=32s\n"}
# 187
{"Time":"2020-07-29T04:35:00.666299105Z","Action":"output","Test":"TestElasticsearchCRDOpenAPIValidation",
 "Output":"I0729 04:35:00.666194 12485 request.go:621] Throttling request took 1.045891547s,
  request: GET:https://172.30.0.1:443/apis/route.openshift.io/v1?timeout=32s\n"}
# 188
{"Time":"2020-07-30T03:46:14.790018559Z","Action":"output","Test":"TestMutationAndReversal",
 "Output":"I0730 03:46:14.789922   12469 request.go:621] Throttling request took 1.043055956s,
  request: GET:https://172.30.0.1:443/apis/autoscaling/v1?timeout=32s\n"}
I don't see how our custom log stream code could produce something like this, it's not even trying to parse or process that timestamp (it processes the k8s timestamp before those logs, which is a different thing).
So it looks to me like an Openshift/apiserver bug when returning the test pod logs.
I'm not sure we can do much about it. The only workarounds I have in mind:
- Figure out why gotestsum stays stuck when this happens, and patch it so it ignores the wrongly formatted line.
- Parse log lines as part of our log stream process, and remove any line with a wrongly formatted timestamp. Loosing one log output and/or result once in a while is probably not too bad.
- Figure out another way to retrieve the tests output in CI. Relying on the test Pod logs seems a bit fragile. Example: upload the
go testoutput to S3 (or any file storage service) and retrieve it from where the Jenkins job runs? I guess this may also lead to its own complications and failures...
sebgl
on 30 Jul 2020
So it looks to me like an Openshift/apiserver bug when returning the test pod logs.
We can look for similar issues but since we can't reproduce it reliably it seems like we would not get too far with opening our own issue. To my knowledge we only run into it on OpenShift, so that might be somewhat helpful in finding the root cause.
Figure out why gotestsum stays stuck when this happens, and patch it so it ignores the wrongly formatted line.
I noticed even with -debug it just seems to silently hang, so I'm +1 to least opening an issue and possibly providing a PR for better behavior.
Parse log lines as part of our log stream process, and remove any line with a wrongly formatted timestamp. Loosing one log output and/or result once in a while is probably not too bad.
This also makes sense to me. It seems difficult for us to parse out a useful (and maybe valid?) timestamp programmatically since they're mixed together at different indices per Thibault's investigation.
anyasabo
on 30 Jul 2020
(unassigning myself since I'm out for the next 3 weeks, anyone feel free to pick this up)
sebgl
on 31 Jul 2020
Currently when the job is stuck, the k8s resources are already cleaned up. It's too late to inspect the k8s resources. I wrote a small script to watch the Jenkins log in real time to be able to check what kubectl logs e2e-pod returns. I did the experiment with #\191.
The bug occured and we could see an invalid timestamp in the Jenkins log:
> curl -s https://devops-ci.elastic.co/job/cloud-on-k8s-e2e-tests-ocp/191/consoleText | grep '"Time":"[^"]*\s[^"]*"'
[2020-07-31T08:50:45.451Z] {"Time":"2020-07-31T08:50:43.53377442020-07-31T08:50:43.533842577Z 45Z","Action":"output","Package":"github.com/elastic/cloud-on-k8s/test/e2e/beat","Test":"TestHeartbeatConfig/ES_cluster_health_should_eventually_be_green","Output":"    --- PASS: TestHeartbeatConfig/ES_cluster_health_should_eventually_be_green (0.01s)\n"}

=> 2020-07-31T08:50:43.53377442020-07-31T08:50:43.533842577Z 45Z
=> 2020-07-31T08:50:43.533774445Z + 2020-07-31T08:50:43.533842577Z
The invalid timestamp does not appear when we retrieve the logs via kubectl:
> k -n e2e-x7xye logs eck-e2e-x7xye-tkxws | grep "2020-07-31T08:50:43.5337744"
{"Time":"2020-07-31T08:50:43.533774445Z","Action":"output","Package":"github.com/elastic/cloud-on-k8s/test/e2e/beat","Test":"TestHeartbeatConfig/ES_cluster_health_should_eventually_be_green","Output":"    --- PASS: TestHeartbeatConfig/ES_cluster_health_should_eventually_be_green (0.01s)\n"}
Moreover the inserted timestamp 2020-07-31T08:50:43.533842577Z does not exist in the full log.
This is strange but does not allow us to conclude much. The bug could come from our end in the way we stream the e2e tests pod log in the runner or from the k8s api-server in the way it serves this pod log.
thbkrkr
on 4 Aug 2020
I'll go ahead and take on working with the gotestsum folks to at least fail fast
anyasabo
on 4 Aug 2020
I would be in favor of implementing a temporary fix by filtering out lines containing a space in the timestamp with a _lovely_ grep pattern (grep -v '"Time":"[^"]*\s[^"]*"'). WDYT?
thbkrkr
on 5 Aug 2020
With the workaround in place, the job ~is~ seems to be very unstable (yellow). Each run reports random flaky tests. This flakiness seems impossible.
> ./list-failed-tests.sh
# cloud-on-k8s-e2e-tests-ocp#202
"TestMutationAndReversal/Elasticsearch_data_volumes_should_be_of_the_specified_type – github.com/elastic/cloud-on-k8s/test/e2e/es"
"TestMutationAndReversal/Elastic_password_should_be_available#02 – github.com/elastic/cloud-on-k8s/test/e2e/es"
"TestDeleteCACert/ES_certificate_authority_should_be_set_and_deployed#01 – github.com/elastic/cloud-on-k8s/test/e2e/es"

# cloud-on-k8s-e2e-tests-ocp#203
"TestEnterpriseSearchConfigUpdate/ES_endpoint_should_eventually_be_reachable – github.com/elastic/cloud-on-k8s/test/e2e/ent"
...
"TestEnterpriseSearchConfigUpdate/EnterpriseSearch_deployment_should_be_created – github.com/elastic/cloud-on-k8s/test/e2e/ent"

# cloud-on-k8s-e2e-tests-ocp#204
"TestEnterpriseSearchConfigUpdate/Create_an_App_Search_engine_(if_not_already_done) – github.com/elastic/cloud-on-k8s/test/e2e/ent"
...
"TestEnterpriseSearchConfigUpdate/ES_endpoint_should_eventually_be_reachable – github.com/elastic/cloud-on-k8s/test/e2e/ent"

# cloud-on-k8s-e2e-tests-ocp#205
"TestApmStandaloneNoTLS/ApmServer_endpoint_should_eventually_be_reachable – github.com/elastic/cloud-on-k8s/test/e2e/apm"
"TestAuditbeatConfig – github.com/elastic/cloud-on-k8s/test/e2e/beat"
"TestAuditbeatConfig/ES_endpoint_should_eventually_be_reachable – github.com/elastic/cloud-on-k8s/test/e2e/beat"
"TestMutationHTTPToHTTPS/Elasticsearch_should_not_be_there_anymore – github.com/elastic/cloud-on-k8s/test/e2e/es"
(source of
list-failed-tests.sh, for posterity)
#!/bin/bash -eu

JKS_BASE_URL=https://devops-ci.elastic.co

JOB_NAME=cloud-on-k8s-e2e-tests-ocp

list_failed_tests() {
    local jobId=$1
    curl -s "$JKS_BASE_URL/blue/rest/organizations/jenkins/pipelines/${JOB_NAME}/runs/${jobId}/tests/" | \
        jq '.[] | select(.status == "FAILED") | .name'
}

main() {
    for jobId in {202..205}; do
        echo "# ${JOB_NAME}#${jobId}"
        list_failed_tests $jobId
        echo
    done
}

main
When trying to get the detail of test failure, there is nothing except only the word Failed. This is because the JUnit XML report generation using gotestsum encountered an issue. We can see in the log that the reason is (unknown):
```[2020-08-11T05:10:46.203Z] + make -C .ci TARGET=e2e-generate-xml ci
[2020-08-11T05:10:46.203Z] make: Entering directory '/var/lib/jenkins/workspace/cloud-on-k8s-e2e-tests-ocp/.ci'
[2020-08-11T05:12:08.495Z] docker.elastic.co/eck-ci/eck-ci-tools:2efcaafc
[2020-08-11T05:12:47.202Z] ✓ test/e2e (26m51.179s)
[2020-08-11T05:12:47.203Z] ✓ test/e2e/apm (11m54.41s)
[2020-08-11T05:12:47.203Z] ✓ test/e2e/beat (22m49.963s)
[2020-08-11T05:12:47.203Z] ∅ test/e2e/cmd
....
[2020-08-11T05:12:47.203Z] === Failed
[2020-08-11T05:12:47.203Z] === FAIL: test/e2e/es TestMutationAndReversal/Elasticsearch_data_volumes_should_be_of_the_specified_type (unknown)
[2020-08-11T05:12:47.203Z]
[2020-08-11T05:12:47.203Z] === FAIL: test/e2e/es TestMutationAndReversal/Elastic_password_should_be_available#02 (unknown)
[2020-08-11T05:12:47.203Z]
[2020-08-11T05:12:47.203Z] === FAIL: test/e2e/es TestDeleteCACert/ES_certificate_authority_should_be_set_and_deployed#01 (unknown)
[2020-08-11T05:12:47.203Z]
[2020-08-11T05:12:47.203Z]
[2020-08-11T05:12:47.203Z] DONE 3667 tests, 16 skipped, 3 failures in 0.179s
The normal behaviour of the generation when there are test failures looks like:
[2020-08-11T09:36:06.522Z] + make -C .ci TARGET=e2e-generate-xml ci
[2020-08-11T09:36:06.523Z] make: Entering directory '/var/lib/jenkins/workspace/cloud-on-k8s-e2e-tests-gke-k8s-versions/.ci'
[2020-08-11T09:36:07.466Z] docker.elastic.co/eck-ci/eck-ci-tools:4084d229
[2020-08-11T09:36:08.408Z] ✓ test/e2e (16m19.673s)
[2020-08-11T09:36:08.408Z] ✓ test/e2e/apm (9m59.692s)
[2020-08-11T09:36:08.408Z] ✖ test/e2e/beat (40m56.459s)
[2020-08-11T09:36:08.408Z]
[2020-08-11T09:36:08.408Z] === Failed
[2020-08-11T09:36:08.408Z] === FAIL: test/e2e/beat TestHeartbeatEsKbHealthRecipe/Beat_health_should_be_green (300.00s)
[2020-08-11T09:36:08.408Z] Retries (5m0s timeout): ....................................................................................................
[2020-08-11T09:36:08.408Z] TestHeartbeatEsKbHealthRecipe/Beat_health_should_be_green: utils.go:84:
[2020-08-11T09:36:08.408Z] Error Trace: utils.go:84
[2020-08-11T09:36:08.408Z] Error: Received unexpected error:
[2020-08-11T09:36:08.408Z] beat heartbeat-dfxh health is yellow
[2020-08-11T09:36:08.408Z] Test: TestHeartbeatEsKbHealthRecipe/Beat_health_should_be_green
[2020-08-11T09:36:08.408Z] {"log.level":"error","@timestamp":"2020-08-11T09:33:32.304Z","message":"stopping early","service.version":"0.0.0-00000000","service.type":"eck","ecs.version":"1.4.0","error":"test failure","error.stack_trace":"github.com/go-logr/zapr.(*zapLogger).Error\n\t/go/pkg/mod/github.com/go-logr/[email protected]/zapr.go:128\ngithub.com/elastic/cloud-on-k8s/test/e2e/test.StepList.RunSequential\n\t/go/src/github.com/elastic/cloud-on-k8s/test/e2e/test/step.go:43\ngithub.com/elastic/cloud-on-k8s/test/e2e/test/helper.RunFile\n\t/go/src/github.com/elastic/cloud-on-k8s/test/e2e/test/helper/yaml.go:152\ngithub.com/elastic/cloud-on-k8s/test/e2e/beat.runBeatRecipe\n\t/go/src/github.com/elastic/cloud-on-k8s/test/e2e/beat/recipes_test.go:239\ngithub.com/elastic/cloud-on-k8s/test/e2e/beat.TestHeartbeatEsKbHealthRecipe\n\t/go/src/github.com/elastic/cloud-on-k8s/test/e2e/beat/recipes_test.go:154\ntesting.tRunner\n\t/usr/local/go/src/testing/testing.go:991"}
[2020-08-11T09:36:08.408Z] --- FAIL: TestHeartbeatEsKbHealthRecipe/Beat_health_should_be_green (300.00s)
[2020-08-11T09:36:08.408Z]
[2020-08-11T09:36:08.408Z] === FAIL: test/e2e/beat TestHeartbeatEsKbHealthRecipe (301.36s)
[2020-08-11T09:36:08.408Z]
[2020-08-11T09:36:08.408Z] DONE 1282 tests, 2 failures in 0.063s
```
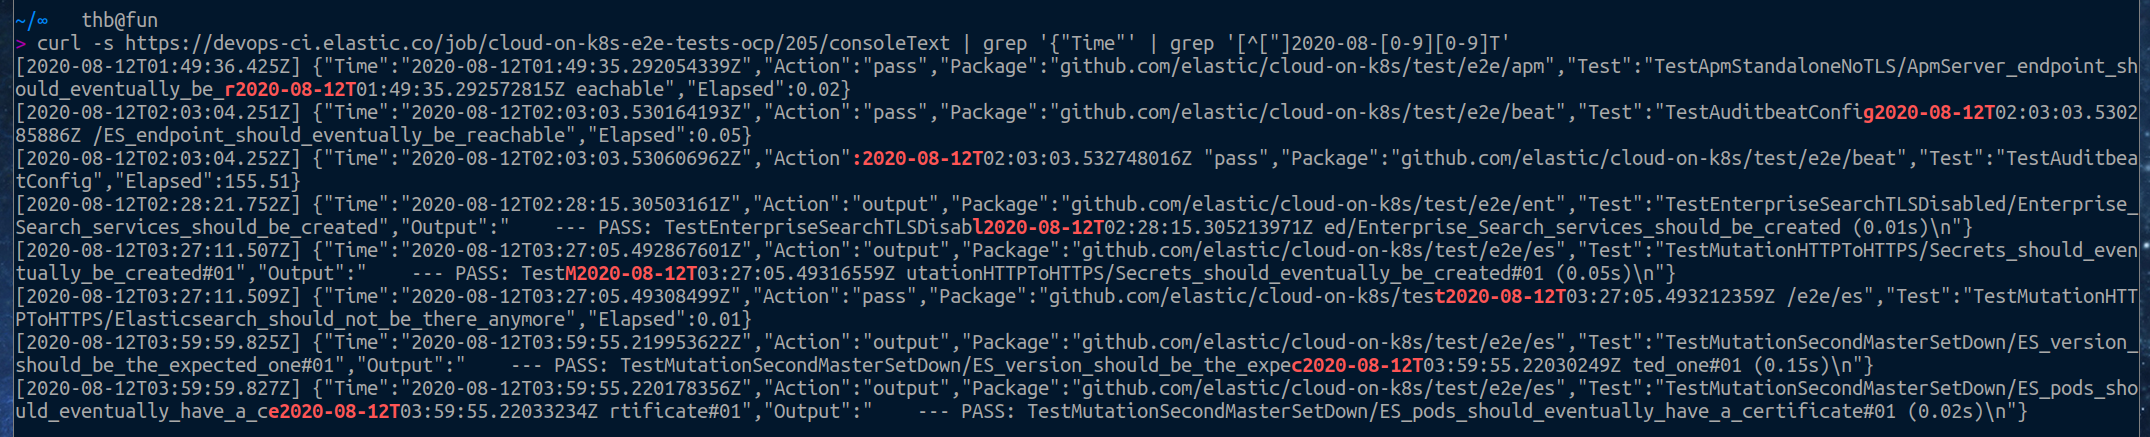
What's going on? Same as before. The log is corrupted with timestamps inserted anywhere and this several times.
thbkrkr
on 12 Aug 2020
I looked at what the generation looked like after removing the extra timestamps:
for i in {202..205}; do echo -n "[$i] ";./gotestsum --junitfile e2e-tests.xml --raw-command ./clean-go-test-json-output.sh $i-consoleText.txt | grep DONE; done
[202] DONE 3667 tests, 16 skipped in 0.143s
[203] DONE 1129 tests, 9 skipped, 30 failures in 0.046s
[204] DONE 1142 tests, 9 skipped, 43 failures in 0.038s
[205] DONE 3667 tests, 16 skipped in 0.115s
The runs 202 and 205 had no test failures but 203 and 204 did. There are all like Retries (10m0s timeout): .. So we hit the timeout after the retries.
Let's look at the occurences of ?timeout=:
> grep -c '?timeout=' 20*-consoleText.txt
202-consoleText.txt:78
203-consoleText.txt:0
204-consoleText.txt:0
205-consoleText.txt:79
> grep '?timeout=' 205-consoleText.txt | grep -o "https.*s" | sort | uniq -c | sort -rn
      4 https://172.30.0.1:443/apis/samples.operator.openshift.io/v1?timeout=32s
      3 https://172.30.0.1:443/apis/template.openshift.io/v1?timeout=32s
      3 https://172.30.0.1:443/apis/storage.k8s.io/v1beta1?timeout=32s
      3 https://172.30.0.1:443/apis/security.openshift.io/v1?timeout=32s
      3 https://172.30.0.1:443/apis/network.openshift.io/v1?timeout=32s
      3 https://172.30.0.1:443/apis/machine.openshift.io/v1beta1?timeout=32s
      3 https://172.30.0.1:443/apis/authorization.openshift.io/v1?timeout=32s
      2 https://172.30.0.1:443/apis/operators.coreos.com/v1alpha2?timeout=32s
      2 https://172.30.0.1:443/apis/operators.coreos.com/v1alpha1?timeout=32s
      2 https://172.30.0.1:443/apis/operator.openshift.io/v1alpha1?timeout=32s
      2 https://172.30.0.1:443/apis/oauth.openshift.io/v1?timeout=32s
      2 https://172.30.0.1:443/apis/node.k8s.io/v1beta1?timeout=32s
      2 https://172.30.0.1:443/apis/metal3.io/v1alpha1?timeout=32s
      2 https://172.30.0.1:443/apis/machineconfiguration.openshift.io/v1?timeout=32s
      2 https://172.30.0.1:443/apis/kibana.k8s.elastic.co/v1?timeout=32s
      2 https://172.30.0.1:443/apis/ingress.operator.openshift.io/v1?timeout=32s
      2 https://172.30.0.1:443/apis/certificates.k8s.io/v1beta1?timeout=32s
      2 https://172.30.0.1:443/apis/batch/v1?timeout=32s
      2 https://172.30.0.1:443/apis/autoscaling/v2beta2?timeout=32s
      2 https://172.30.0.1:443/apis/autoscaling.openshift.io/v1beta1?timeout=32s
      2 https://172.30.0.1:443/apis/apps/v1beta1?timeout=32s
      2 https://172.30.0.1:443/apis/apm.k8s.elastic.co/v1beta1?timeout=32s
      1 https://172.30.0.1:443/api/v1?timeout=32s
      1 https://172.30.0.1:443/apis/whereabouts.cni.cncf.io/v1alpha1?timeout=32s
      1 https://172.30.0.1:443/apis/user.openshift.io/v1?timeout=32s
      1 https://172.30.0.1:443/apis/scheduling.k8s.io/v1beta1?timeout=32s
      1 https://172.30.0.1:443/apis/rbac.authorization.k8s.io/v1?timeout=32s
      1 https://172.30.0.1:443/apis/project.openshift.io/v1?timeout=32s
      1 https://172.30.0.1:443/apis/packages.operators.coreos.com/v1?timeout=32s
      1 https://172.30.0.1:443/apis/operators.coreos.com/v2?timeout=32s
      1 https://172.30.0.1:443/apis/operators.coreos.com/v1?timeout=32s
      1 https://172.30.0.1:443/apis/networking.k8s.io/v1?timeout=32s
      1 https://172.30.0.1:443/apis/networking.k8s.io/v1beta1?timeout=32s
      1 https://172.30.0.1:443/apis/kibana.k8s.elastic.co/v1beta1?timeout=32s
      1 https://172.30.0.1:443/apis/enterprisesearch.k8s.elastic.co/v1beta1?timeout=32s
      1 https://172.30.0.1:443/apis/elasticsearch.k8s.elastic.co/v1?timeout=32s
      1 https://172.30.0.1:443/apis/coordination.k8s.io/v1beta1?timeout=32s
      1 https://172.30.0.1:443/apis/console.openshift.io/v1?timeout=32s
      1 https://172.30.0.1:443/apis/cloudcredential.openshift.io/v1?timeout=32s
      1 https://172.30.0.1:443/apis/beat.k8s.elastic.co/v1beta1?timeout=32s
      1 https://172.30.0.1:443/apis/batch/v1beta1?timeout=32s
      1 https://172.30.0.1:443/apis/autoscaling/v2beta1?timeout=32s
      1 https://172.30.0.1:443/apis/autoscaling.openshift.io/v1?timeout=32s
      1 https://172.30.0.1:443/apis/authorization.k8s.io/v1?timeout=32s
      1 https://172.30.0.1:443/apis/authentication.k8s.io/v1?timeout=32s
      1 https://172.30.0.1:443/apis/authentication.k8s.io/v1beta1?timeout=32s
      1 https://172.30.0.1:443/apis/apps/v1beta2?timeout=32s
      1 https://172.30.0.1:443/apis/apm.k8s.elastic.co/v1?timeout=32s
      1 https://172.30.0.1:443/apis/apiregistration.k8s.io/v1beta1?timeout=32s
Edit: I omitted one important element. We seem to hit a timeout because our request are throttled. Complete errors:
"I0812 05:10:26.899317   12519 request.go:621] Throttling request took 1.042242771s, request: GET:https://172.30.0.1:443/apis/security.openshift.io/v1?timeout=32s\n"
"I0812 05:13:25.798027   12519 request.go:621] Throttling request took 1.043004457s, request: GET:https://172.30.0.1:443/apis/samples.operator.openshift.io/v1?timeout=32s\n"
"I0812 05:18:17.169771   12519 request.go:621] Throttling request took 1.043857477s, request: GET:https://172.30.0.1:443/apis/operator.openshift.io/v1alpha1?timeout=32s\n"
"I0812 05:21:54.639877   12519 request.go:621] Throttling request took 1.043233388s, request: GET:https://172.30.0.1:443/apis/metal3.io/v1alpha1?timeout=32s\n"
"I0812 05:23:46.621108   12519 request.go:621] Throttling request took 1.043294508s, request: GET:https://172.30.0.1:443/apis/project.openshift.io/v1?timeout=32s\n"
_(The closing was a false manipulation.)_
What do we learn?
- [1] All runs of the ocp job have extra timestamps inserted anywhere that corrupt the go test json output and make false negative test failures.
- [2] In some (not all) runs, we regularly hit the timeout when we hit the apiserver, which creates further false negative test failures.
We could implement a quick workaround for [1] but not easily for [2].
[2] may be due to an environment issue which could also be the root cause of [1].
thbkrkr
on 12 Aug 2020
Last run (206) is successful despite:
- there are 79
Throttling request ..., ?timeout=...errors. - 2 extra timestamps inserted in the log BUT luckily:
- the first one is in the
Timefield, so it is filtered by the current workaround. - the second is in the
Outputfield, so it corrupts nothing.
- the first one is in the
thbkrkr
on 13 Aug 2020
Note: we are using OCP 4.3.19. OCP 4.3.31 is available but I don't see anything interesting that could relate to our current issue, but it shouldn't hurt to update.
thbkrkr
on 13 Aug 2020
Spent some time on this one, trying to sum up my current investigations:
Who is adding a timestamp followed by a whitespace character in the middle of the logs ?
I think it is K8S, this is what we are expecting since this issue ... but we are expecting K8S to do so only at the beginning of new lines. It seems that the underlying source is splitting some log messages ...
Why is it only happening on Openshift ?
Logs are collected on the filesystem of the K8S node by the container runtime. I believe that on almost all platforms it is Docker, but in the case of Openshift it is CRI-O. I'm suspecting CRI-O to split some messages. I spent some time looking at current/past issues, the source code ... but unfortunately I'm not able to explain why it is happening.
What's next ?
I'll try to investigate once again if there is something suspicious in the log mechanism of cri-o.
But I think we might try a workaround:
IIUC we want the logs of that Pod for 2 reasons:
- Being able to follow the tests on Jenkins or get them through the Jenkins web UI when the job is done.
- Create the file
e2e-tests.json, to be consumed bygotestsum
The issue we are facing here is only a concern for gotestsum (i.e. 2.), as humans I think that we can tolerate having some corrupted lines in Jenkins.
My proposal would be:
- For
1.to keep the current mechanism - For
2.to create thee2e-tests.jsonas a last step, at the end of the Jenkins job, by reading the Pod logs from scratch, from the beginning, in a one time operation, without trying to stream them continuously. I think that the current complexity comes from the fact that we want to stream the logs and send them tostdout+e2e-tests.json, while streaming the Pod logs seems to be an unreliable process.
Please let me know if anyone sees an issue with this.
 barkbay
on 17 Aug 2020
barkbay
on 17 Aug 2020
I'm suspecting CRI-O to split some messages.
From https://bugzilla.redhat.com/show_bug.cgi?id=1552304:
Cause: Log messages from cri-o pod could be split in the middle by nature.
Consequence: Partial log messages are indexed in the elasticsearch.
Also:
- Maybe related/mitigated by https://github.com/kubernetes/kubernetes/pull/77822
- Regarding my last proposal: it looks like our current e2e tests already generate something between 5 and 6 MB of logs, logs rotation seems to usually happen when log file exceeds 10MB. I think we would lose some messages if they exceed this value.
barkbay
on 18 Aug 2020
- there are 79
Throttling request ..., ?timeout=...errors.
These are actually not errors, it's just to let the user know that the client has throttled the request.
The default qps is 5 which seems a bit low to me, I'm a surprised that we only get that message on Openshift 🤔
barkbay
on 18 Aug 2020
Resolved by #3640.
thbkrkr
on 4 Sep 2020
Related issues
sebgl
·
5Comments
 Sakib37
·
3Comments
sebgl
·
3Comments
sebgl
·
5Comments
thbkrkr
·
5Comments
Sakib37
·
3Comments
sebgl
·
3Comments
sebgl
·
5Comments
thbkrkr
·
5Comments
Most helpful comment
Spent some time on this one, trying to sum up my current investigations:
Who is adding a timestamp followed by a whitespace character in the middle of the logs ?
I think it is K8S, this is what we are expecting since this issue ... but we are expecting K8S to do so only at the beginning of new lines. It seems that the underlying source is splitting some log messages ...
Why is it only happening on Openshift ?
Logs are collected on the filesystem of the K8S node by the container runtime. I believe that on almost all platforms it is Docker, but in the case of Openshift it is CRI-O. I'm suspecting CRI-O to split some messages. I spent some time looking at current/past issues, the source code ... but unfortunately I'm not able to explain why it is happening.
What's next ?
I'll try to investigate once again if there is something suspicious in the log mechanism of cri-o.
But I think we might try a workaround:
IIUC we want the logs of that Pod for 2 reasons:
e2e-tests.json, to be consumed bygotestsumThe issue we are facing here is only a concern for
gotestsum(i.e.2.), as humans I think that we can tolerate having some corrupted lines in Jenkins.My proposal would be:
1.to keep the current mechanism2.to create thee2e-tests.jsonas a last step, at the end of the Jenkins job, by reading the Pod logs from scratch, from the beginning, in a one time operation, without trying to stream them continuously. I think that the current complexity comes from the fact that we want to stream the logs and send them tostdout+e2e-tests.json, while streaming the Pod logs seems to be an unreliable process.Please let me know if anyone sees an issue with this.