Cloud-on-k8s: Stack monitoring with Metricbeat
Related to #2051
Three possible approaches to collecting monitoring data from Elastic stack containers come to mind
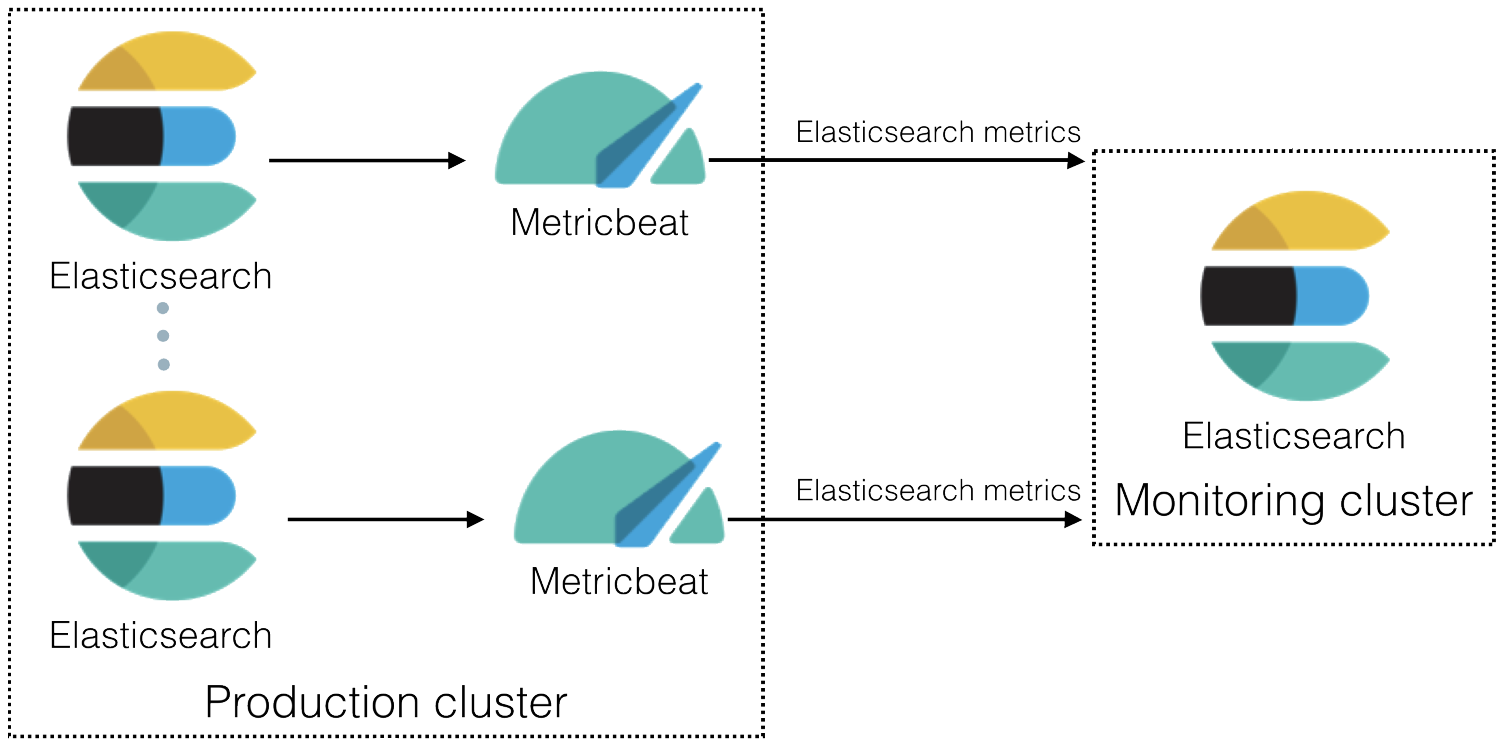
- via a centrally managed Metricbeat instance
- via a process running inside the stack (e.g. Elasticsearch) container
- via a sidecar container next to the stack (e.g. Elasticsearch) container
Central management
- Basically extending on the
DaemonSetadvertised in https://www.elastic.co/guide/en/beats/metricbeat/current/running-on-kubernetes.html - Most resource effective (one Metricbeat process per k8s node)
- Difficult to configure:
- we need to add configuration stanzas to the Metricbeat config files as pods are scheduled on a specific k8s node and remove them again if they get scheduled somewhere else
- unclear ownership of the configuration files
- multiple processes writing concurrently to same
ConfigMapto add or remove configuration files if we share aConfigMapbetween e.g. Elasticsearch clusters - or alternatively a potentially high number of volume mounts to manage on the Metricbeat pod if we don't share a k8s resource but every stack pod needs mount its own monitoring configuraiton into the Metricbeat pod with a restart of the Metricbeat pod at each such occasion
- Only one output Elasticsearch cluster possible
The disadvantages seem to outweigh the benefits of saving resources.
In-container Metricbeat process
While this feels like a container anti-pattern at first, the stack seems to be going into that direction starting with version 8.0.0 see https://github.com/elastic/elasticsearch/issues/49399 and https://github.com/elastic/kibana/issues/51224
- Very hacky to do this before the official images support it (we had a similar approach with the shortlived process manager in one of the ECK alpha versions)
- Would require introduction of a process manager to handle stray child processes
- I would assume that this could be disruptive to existing deployments if we introduce this in a future version of ECK because sizing and resource requests/limits would have been done without this extra process in mind (we could work around this of course by bumping the resources on rollout, but that in itself is also problematic as we might cause rescheduling of nodes etc)
Unless we have support for this in the official Docker containers we should avoid this route.
Sidecar Metricbeat process
- would the be the most k8s-native way of a running a Metricbeat process alongside each Elastic stack container
- localhost network access from Metricbeat to the stack process (e.g. Elasticsearch)
- Metricbeat shares the same 'fate' as the stack process and follows it around as it is rescheduled etc
- possible for users to configure this today with hand-crafted sidecar
- Monitoring data can be reporting into different monitoring clusters as needed (because each monitored container is running it's own instance of Metricbeat)
- ECK could add value by automating (here for an Elasticsearch example, see below) most of the steps in https://www.elastic.co/guide/en/elasticsearch/reference/7.5/configuring-metricbeat.html for example:
- access to user credentials on the monitoring cluster
- propagation of certificates for both the monitoring cluster and the monitored cluster
- turning on stack monitoring in Elasticsearch
- Challenges:
- it looks like new certs on certificate rotation are not automatically picked up by Metricbeat
localhostaccess requireslocalhostto be a SAN in the generated certificates (or we have to the turn of cert validation in Metricbeat)- migration from the current state to the monitored state (additional resources needed for Metricbeat might trigger rescheduling, or cause problems in use cases with local persistent volumes and limited resources on the k8s nodes)
apiVersion: elasticsearch.k8s.elastic.co/v1beta1
kind: Elasticsearch
metadata:
  name: my-cluster
spec:
  version: 7.5.0
  http:
    tls:
      selfSignedCertificate:
        subjectAltNames:
        - dns: localhost
  nodeSets:
  - name: default
    count: 3
    podTemplate:
      metadata:
         annotations:
           "co.elastic.logs/module": elasticsearch
      spec:
        containers:
        - name: metricbeat
          image: docker.elastic.co/beats/metricbeat:7.5.0
          args: [
          "-c", "/etc/metricbeat.yml",
          "-e"
          ]
          env:
          - name: MONITOR_HOST
            value: monitor-es-http.beats
          - name: MONITOR_PORT
            value: "9200"
          - name: MONITOR_USERNAME
            value: elastic
          - name: MONITOR_PASSWORD
            valueFrom:
              secretKeyRef:
                key: elastic
                name: monitor-es-elastic-user
          - name: ELASTICSEARCH_PASSWORD
            valueFrom:
              secretKeyRef:
                key: elastic
                name: my-cluster-es-elastic-user
          - name: NODE_NAME
            valueFrom:
              fieldRef:
                fieldPath: spec.nodeName
          resources:
            limits:
              memory: 200Mi
            requests:
              cpu: 100m
              memory: 100Mi
          volumeMounts:
          - name: config
            mountPath: /etc/metricbeat.yml
            readOnly: true
            subPath: metricbeat.yml
          - name: monitor-certs
            mountPath: /mnt/monitor/tls.crt
            readOnly: true
            subPath: tls.crt
          - name: es-certs
            mountPath:  /mnt/elastic/tls.crt
            readOnly: true
            subPath: tls.crt
        volumes:
        - name: config
          configMap:
            name: my-cluster-metricbeat
        - name: monitor-certs
          secret:
            secretName: monitor-es-http-certs-public
        - name: es-certs
          secret:
            secretName: my-cluster-es-http-certs-public

---
apiVersion: v1
kind: ConfigMap
metadata:
  name: my-cluster-metricbeat
  labels:
    k8s-app: metricbeat
data:
  metricbeat.yml: |-
    metricbeat.modules:
    - module: elasticsearch
      metricsets:
        - ccr
        - enrich
        - cluster_stats
        - index
        - index_recovery
        - index_summary
        - ml_job
        - node_stats
        - shard
      period: 10s
      xpack.enabled: true
      hosts: ["https://localhost:9200"]
      username: "elastic" # TODO use monitoring user
      password: ${ELASTICSEARCH_PASSWORD}
      ssl.certificate_authorities: ["/mnt/elastic/tls.crt"]


    processors:
      - add_cloud_metadata:

    output.elasticsearch:
      hosts: ['https://${MONITOR_HOST:elasticsearch}:${MONITOR_PORT:9200}']
      username: ${MONITOR_USERNAME}
      password: ${MONITOR_PASSWORD}
      ssl.certificate_authorities:
      - /mnt/monitor/tls.crt
 pebrc
pebrc
All 17 comments
Edit: I misunderstood so this comment is not useful, please ignore. Leaving it up for posterity.
My inclination is the central management (and is similar in deployment to e.g. prometheus scrapers). From the link you mentioned, I think we would only be using a deployment for this use case:
As a single Metricbeat instance created using a Deployment. This instance is used to retrieve metrics that are unique for the whole cluster, such as Kubernetes events or kube-state-metrics.
There's no need to have a daemon set for this use case since it doesn't need to run on every node or do anything local to the node.
I also don't think we would need to modify the metricbeat configuration regularly if we can get autodiscover working correctly. I had some difficulty using it with label selectors in the past, but it _should_ work.
I don't remember if we can expose prometheus metrics in ES without auth, but that would indeed require modifying the metricbeat deployment whenever we want to make changes and be a pain. IMO we would want to expose them without auth.
 anyasabo
on 13 Jan 2020
anyasabo
on 13 Jan 2020
@anyasabo I am going to use Elasticsearch as the example below but stack monitoring applies to other Elstic stack products as well of course.
I think we would only be using a deployment for this use case:
There's no need to have a daemon set for this use case since it doesn't need to run on every node or do anything local to the node.
Hm this might be a misunderstanding, but this issue is about the monitoring feature build into the different stack products. So for Elasticsearch, the monitoring you enable via xpack.monitoring.collection.enabled see https://www.elastic.co/guide/en/elasticsearch/reference/7.5/configuring-metricbeat.html For stack monitoring via Metricbeat you have to run Metricbeat on each node
I also don't think we would need to modify the metricbeat configuration regularly if we can get autodiscover working correctly. I had some difficulty using it with label selectors in the past, but it should work.
If we were to use a shared Metricbeat instance on each k8s node we would need to modify the configuration whenever a new Elasticsearch cluster is created or removed or rescheduled to another node.
Also I don't think autodiscover would work here, in order to talk to Elasticsearch we need credentials and certificates and I don't think we can configure those via autodiscovery because we need to actually mount the relevant secrets into the Metricbeat pods.
I don't remember if we can expose prometheus metrics in ES without auth
I don't think you can expose any Prometheus metrics in ES without third-party tooling.
pebrc
on 14 Jan 2020
Also I don't think autodiscover would work here, in order to talk to Elasticsearch we need credentials and certificates and I don't think we can configure those via autodiscovery because we need to actually mount the relevant secrets into the Metricbeat pods.
As a note here, this is something we have been thinking on for a while and we may start working on it soon, but we don't have a target release for it yet.
 exekias
on 15 Jan 2020
exekias
on 15 Jan 2020
One hybrid option that may make sense: one metricbeat deployment per Elasticsearch cluster. That way each cluster can output to a separate monitoring cluster if necessary. We don't need to regularly modify the secrets mounted into metricbeat since it is just monitoring one cluster. For the metricbeat configuration, we can also use autodiscover for that cluster's labels so once it is created we shouldn't need to modify it. It also lets us use less resources than we would using a sidecar and is straightforward to implement.
I'm not sure if there's a limit on how many hosts metricbeat can realistically scrape at once.
Another downside is that it is still using more resources than if we had one metricbeat deployment for multiple Elasticsearch clusters (the "Central management" option in Peter's original post). This may be significant for users with many ES clusters.
Maybe it's worth picking one of the simpler to implement options now, and we can potentially alter it later to allow more density?
anyasabo
on 16 Jan 2020
Do we have any data on the metricbeat resource consumption? It seems that this would get us more insights about how much we really save on not doing sidecar approach.
As for the deployment per cluster, I have mixed feelings, mostly around scalability and spof. Are we sure we can handle any cluster size this way? Would pod running that metricbeat become noisy at some scale?
I think if ES is introducing a solution to this problem in 8.0 we should follow that solution. As to the pre-8.0 versions (for which, I assume, we also want to introduce this) I'd be for doing the sidecar as it seems most straightforward and "native".
 david-kow
on 17 Jan 2020
david-kow
on 17 Jan 2020
@pebrc if we end up doing anything else but using the bundled beats in the stack images, can you ping me? I’m not saying it’s no good but I would like to understand the reasons in that case.
 bleskes
on 22 Jan 2020
bleskes
on 22 Jan 2020
In-container Metricbeat process
While this feels like a container anti-pattern at first, the stack seems to be going into that direction starting with version 8.0.0 see elastic/elasticsearch#49399 and elastic/kibana#51224
Very hacky to do this before the official images support it (we had a similar approach with the shortlived process manager in one of the ECK alpha versions)
Agreed this feels like a container anti-pattern. The primary argument in favor of it that I read in any of the stack issues was that it is easier for people to deploy, and remains similar to the in-stack monitoring collection configuration. I didn't see any discussion of the cons in the list, so here are some of the reasons why I'd prefer to keep beats and stack containers separate at least for Kubernetes deployments:
- readiness / liveness checks are per container and much easier to reason about as relevant to one process. If you have multiple independent processes you care about in the same container it becomes harder to reason about. What happens if you need to restart just the metricbeat process? What happens if metricbeat dies but ES continues successfully? Some adjacent discussion in the ES issue here.
- simplified logging. Centralized logging often tags logs by the container, so if I want to see elasticsearch logs it's common to search for
container:elasticsearch, and likewise for beats searching forcontainer:metricbeat. If they're all bundled together it makes sorting through stack and instrumentation logs difficult. There are similar issues usingkubectl logs. - k8s allows per container resource requests/limits. most in-cluster metrics and monitoring are also granular to the container level, not to the process. having both in one container would mean we need to set combined resource requests/limits for both the stack and for beats, and we cannot observe resource utilization for either independently
Note that these are just arguments against having them in the same container -- we could still have them as separate containers in the same pod (so access to the same namespace, fs, etc).
And to reiterate Peter's point, we would only be able to use the in-container method in >=8.0, we would still need some method to support earlier versions.
I don't think the ease of deployment is a very strong argument for adopting in-container metricbeats for ECK, since adding a sidecar results in a very similar end state (one metricbeat/ES node, access to the same namespace/fs) and is pretty straightforward for us to implement.
anyasabo
on 23 Jan 2020
Is there a particular reason for us to rely on Metricbeat for stack monitoring?
IIUC, stack monitoring in the current stack version can be done through exporters running in Elasticsearch. Which in future Elasticsearch versions may be replaced by Metricbeat.
Isn't it simpler for us to just use that feature instead of deploying Metricbeat in our own way?
Users can already configure Elasticsearch the following way:
xpack.monitoring.collection.enabled: true
xpack.monitoring.exporters:
  id1:
    type: http
    host: ["https://es-mon1:9200", "https://es-mon2:9200"]
    auth:
      username: remote_monitoring_user
      password: YOUR_PASSWORD
    ssl:
      truststore.path: /path/to/file
      truststore.password: password
If we want to simplify this bit of configuration, I guess we could propose something like the following in the Elasticsearch resource:
apiVersion: elasticsearch.k8s.elastic.co/v1
kind: Elasticsearch
metadata:
  name: quickstart
spec:
  version: 7.5.2
  monitoring:
    enable: true
    exporters:
      elasticsearchRef:
        namespace: monitoring-ns
        name: my-monitoring-cluster
  nodeSets:
  - name: default
    count: 1
If Elasticsearch runs Metricbeat internally in future versions I don't think that would impact us in a meaningful way, we would probably just setup a different ES configuration internally instead, but maybe keep the same ES resource.
 sebgl
on 23 Jan 2020
sebgl
on 23 Jan 2020
One additional concern @pebrc smartly raised: beats are forward-compatible with ES within a major but not backwards compatible, e.g. metricbeat 7.3 will work with ES 7.3 - 8.0, but not ES 7.2. It might work, but it is not tested. That said, it should just fail until ES is upgraded, similar to Kibana. This is the same issue described in: https://github.com/elastic/cloud-on-k8s/issues/2600
It's not clear to me if we want to enforce metricbeat version == elasticsearch version for now, or if we want to use the least common denominator. For instance, if the source Elasticsearch is 7.3 and the destination Elasticsearch is 7.2, use metricbeat version 7.2. This only applies to elasticsearchRefs where we can parse the version easily. It's not clear to me which we want to do, and even if we want to do the least common denominator, do we do it at first or leave it as an improvement?
I also wonder if we want to add a webhook validation for incompatible versions (say src ES 7.2 dest ES 6.8).
See the compatibility matrix for more detail.
I'd also like to flesh out the spec a little bit more. I think we would like to support both elasticsearchRefs and providing a list of secrets containing the ES output information (though potentially only elasticsearchRefs at first). This rules out the naive approach of simply having a spec.monitoring that is a []ElasticsearchRef. So I think we may want something more like
type ElasticsearchSpec struct {
...
    // Monitoring contains Elasticsearch references to send stack monitoring metrics to.
    Monitoring Monitoring `json:"monitoring,omitempty"`
...
}

type Monitoring struct {
    // ServiceAccountName is used to check access from the current resource to a resource (eg. Elasticsearch) in a different namespace.
    // Can only be used if ECK is enforcing RBAC on references.
    // +optional
    ServiceAccountName string `json:"serviceAccountName,omitempty"`
    ElasticsearchRefs []commonv1.ObjectSelector `json:"elasticsearchRefs,omitempty"`
    Secrets []string `json:"secrets,omitempty"`
}
Each of these will spin up a sidecar with a configuration similar to the example in the first post, with an output to the specified cluster. Users could then override the containers in the podTemplate similar to init containers today.
I favor this approach, but would wait to implement the Secrets until later. I just want to make sure we leave room to implement it later.
anyasabo
on 6 Mar 2020
Is there a particular reason for us to rely on Metricbeat for stack monitoring?
We discussed this out of band, but to update it here: the plan is to remove internal collection in 8.x regardless of the status of bundling metricbeat into the ES image, so we chose to use the sidecar since it will work with 6.x, 7.x, and 8.x. If it was not for the future removal it would be tempting to use internal collection due to the ease of configuration.
anyasabo
on 9 Mar 2020
so we chose to use the sidecar since it will work with 6.x, 7.x, and 8.x.
Can you clarify the reasoning not to go with autodiscovery first?
/cc @roncohen for visibility and guidance.
bleskes
on 9 Mar 2020
@bleskes tl;dr: it's not feasible to use autodiscover currently without compromising security and/or ugly workarounds.
There's a few ways we might use autodiscover: we could have one central metricbeat that monitors all elasticsearch instances across an entire k8s cluster. This has some challenges:
Our clusters have security enabled by default and each cluster has its own CA, so we would need to mount the CAs and credentials into the metricbeat pod(s).
- We could potentially work around this by granting the monitoring_user role to the anonymous user. We would also want to disable SSL verification so we do not need to copy the CAs.
- If we keep it secure by default, at that point there's not much reason to use autodiscovery, since we are updating the Metricbeat configuration every time we add or remove an Elasticsearch resource (though we would not need to update it on scale/up down, so still _some_ benefit). We have not run benchmarks but my intuition is that this would not scale well.
We could also use one Metricbeat instance per Elasticsearch cluster. This would keep us from needing to reconcile cluster-wide secrets. There are two implementation issues:
- We currently only create HTTP certificates for the service, not for each pod. Metricbeat only supports
fullandnoneSSL verification, and connects directly to the pod, not the service. So we would need to change how we generate and mount certificates. We already do this for transport certs, so implementing it on our side is doable. It would break users who provide us their own certificates though. Our only verification check is that it is signed by the CA. This could be worked around if Metricbeat also supportedmode: certificateas Elasticsearch does. EDIT: Found an already open issue and commented on it: https://github.com/elastic/beats/issues/8164 - Autodiscover spins up events for each defined port on the container. We define ports for both http and transport, so metricbeat works for the http port, but errors out connecting to transport and continues to do so indefinitely. There is an open issue. We could hardcode the port, which would work for the majority of users, but we do allow them to customize the port ES listens on. We could also just ignore the errors, but it's pretty noisy.
The hope is that we could at least switch to the second option with the same user interface in the future, but for now Metricbeat seemed the simplest.
From @exekias's comment upthread some of this may change in the future, but nothing concrete yet.
anyasabo
on 9 Mar 2020
A few implementation issues that came up / questions:
It would be helpful to allow users to easily modify the sidecar similar to how they can modify the primary container today. This would be a larger refactor though, and is essentially the same as https://github.com/elastic/cloud-on-k8s/issues/2306. The pod template builder WithX() funcs are designed around only modifying one container. I think we could modify them to accept a container name rather than that being implicit, which would work for the init containers and sidecar(s). I think it makes sense to ship the first version of stack monitoring without users being able to easily merge settings changes into the sidecar, and leaving that as an enhancement for later.
Secondly, the current association model is designed around 1:1 associations -- each Kibana is associated with only one Elasticsearch instance. This makes it slightly more complicated to implement multiple elasticsearchRefs.
For example, see the associated/associator interfaces which expects to be have one ref per k8s object.
We currently store the association info in the association.k8s.elastic.co/es-conf annotation. For example:
association.k8s.elastic.co/es-conf: '{"authSecretName":"quickstart-kibana-user","authSecretKey":"default-quickstart-kibana-user","caCertProvided":true,"caSecretName":"quickstart-kb-es-ca","url":"https://quickstart-es-http.default.svc:9200"}'
It's currently just straight up an AssociationConf, and so would need to be reworked to store multiples.
I wonder if it makes sense to stick with the CRD design proposed here https://github.com/elastic/cloud-on-k8s/issues/2415#issuecomment-595536736, but limit the length of ElasticsearchRefs to 1. This means for now, we would only have one associated Elasticsearch monitoring. In the future we could rework the association design to allow for multiple associated objects, and remove the length limit. I'll need to think about it more, but wanted to raise this sooner than later to get your all's thoughts. Maybe some things are easier or harder than I'm imagining.
anyasabo
on 9 Mar 2020
I think you folks covered all the options:
- Bundling agent in the ES containers (this is an anti pattern)
- Having a single agent monitoring all clusters (we don't support multiple outputs yet so this is a non-go)
- Running Metricbeat as a sidecar to ES/Kibana.
- Running a Metricbeat per cluster (with autodiscover).
The sidecar approach looks good enough to me, in general the only bit I dislike about it is that you don't have fine grained control over the Metricbeat agent, as it's lifecycle is tied to the Elasticsearch/Kibana node. For instance, operations like pausing/stopping monitoring collection will become challenging.
Running a Metricbeat per cluster is also nice, as it solves the above stated problems. I see you are facing some other issues and would love to dig more into them:
We could also use one Metricbeat instance per Elasticsearch cluster. This would keep us from needing to reconcile cluster-wide secrets. There are two implementation issues:
- We currently only create HTTP certificates for the service, not for each pod. Metricbeat only supports
fullandnoneSSL verification, and connects directly to the pod, not the service. So we would need to change how we generate and mount certificates. We already do this for transport certs, so implementing it on our side is doable. It would break users who provide us their own certificates though. Our only verification check is that it is signed by the CA. This could be worked around if Metricbeat also supportedmode: certificateas Elasticsearch does. I did not open up an issue for this.
I guess the new mode for SSL verification is something we could discuss implementing.
- Autodiscover spins up events for each defined port on the container. We define ports for both http and transport, so metricbeat works for the http port, but errors out connecting to transport and continues to do so indefinitely. There is an open issue. We could hardcode the port, which would work for the majority of users, but we do allow them to customize the port ES listens on. We could also just ignore the errors, but it's pretty noisy.
Same here, we already discussed this one and it's something we want to implement.
exekias
on 12 Mar 2020
After some out of band discussion we decided to pause implementing stack monitoring as a sidecar for the time being, and investigate further if it could be modeled as part of the generic beats design: https://github.com/elastic/cloud-on-k8s/issues/2417. This means stack monitoring will likely not ship in 1.1, but that is TBD.
It started to feel more like modifying Elasticsearch spec to include a stack monitoring section was a little unwieldy and not in line with how people interact with the specs today. Here are two example yamls that attempt to accomplish the same thing: setting up stack monitoring for an elasticsearch resource, while modifying the metricbeat config and metricbeat resources.
The biggest difference is the lack of a top level config item, which is a convenient way for people to modify the elasticsearch.yml. There's not a great way as a sidecar to modify the metricbeat.yml. You can use env vars in the container, but I'm not sure what the syntax would be for some of them.
That said, it's not clear to me how necessary modifying the config would be -- the options I can see the most are the metricsets and the period. The rest is basically just the input and output information. So maybe it is not that big of a downside.
It's also problematic to modify the Elasticsearch CRD without being very confident that is correct, since it is already v1 and we do not want to make breaking changes unless it's necessary. It seemed prudent to do some more investigation and make sure we cannot wrap stack monitoring into the generic beats CRD.
anyasabo
on 13 Mar 2020
To sum up where we stand today:
This is temporarily blocked while we wait to merge the generic beats CRD (initial PR here). It may be that stack monitoring shares code or wraps a beats crd object. This will likely land in 1.2.
We would also like to have beats support certificate ssl verification mode, but the issue has not been taken up yet, so it seems it is likely a couple releases out at a minimum. We could start building stack monitoring beforehand, but it would either have no SSL or would only work with ECK-managed certificates for ES until we have that. This seems acceptable for an alpha version though, and once beats supports the feature it would just be changing a constant.
anyasabo
on 29 May 2020
Status update:
Adding a stack monitoring CRD is not currently planned. We added a stack monitoring recipe using the generic beats CRD. We have avoided adding "presets" or defaults for different known beat types in favor of using recipes, and the same arguments apply to stack monitoring. This avoids a lot of the configuration merging issues and allows for much simpler testing.
The main argument remaining for adding a stack monitoring type is that keeping the monitored resource's CAs in sync across namespaces would be handled by ECK if we added a stack monitoring CRD. As it is you would need to keep them in sync yourself. Inside the same namespace you can just use the same secrets and stay in sync automatically (which is what the recipe does), so that is easy today. This is only mildly persuasive to me and I would want to see more examples of this causing issues before deciding.
If the recipe approach proves to be problematic we can revisit adding a stack monitoring CRD (and maybe other beats presets).
The other stack monitoring approach we discussed was adding a sidecar to allow for per-resource log shipping. This can be accomplished by using autodiscover scoped to specific labels, which we have a recipe for. This does require host access though, but seems to be good enough for now. If there is a stronger need for a non-privileged solution in the future, we may revisit the sidecar approach.
The looser TLS hostname validation feature https://github.com/elastic/beats/issues/8164 has not been picked up yet, but I will check with the beats team if they are planning on it soon or would be open to a PR. Currently the stack monitoring recipe disables TLS to the monitored cluster which is Not Good.
At this time I don't think there's a good reason to keep this issue open. Unless there's objections I'll close it in a few days.
anyasabo
on 21 Jul 2020
Related issues
sebgl
·
3Comments
pebrc
·
3Comments
sebgl
·
3Comments
 SebastianCaceresUltra
·
3Comments
sebgl
·
5Comments
SebastianCaceresUltra
·
3Comments
sebgl
·
5Comments
Most helpful comment
Status update:
Adding a stack monitoring CRD is not currently planned. We added a stack monitoring recipe using the generic beats CRD. We have avoided adding "presets" or defaults for different known beat types in favor of using recipes, and the same arguments apply to stack monitoring. This avoids a lot of the configuration merging issues and allows for much simpler testing.
The main argument remaining for adding a stack monitoring type is that keeping the monitored resource's CAs in sync across namespaces would be handled by ECK if we added a stack monitoring CRD. As it is you would need to keep them in sync yourself. Inside the same namespace you can just use the same secrets and stay in sync automatically (which is what the recipe does), so that is easy today. This is only mildly persuasive to me and I would want to see more examples of this causing issues before deciding.
If the recipe approach proves to be problematic we can revisit adding a stack monitoring CRD (and maybe other beats presets).
The other stack monitoring approach we discussed was adding a sidecar to allow for per-resource log shipping. This can be accomplished by using autodiscover scoped to specific labels, which we have a recipe for. This does require host access though, but seems to be good enough for now. If there is a stronger need for a non-privileged solution in the future, we may revisit the sidecar approach.
The looser TLS hostname validation feature https://github.com/elastic/beats/issues/8164 has not been picked up yet, but I will check with the beats team if they are planning on it soon or would be open to a PR. Currently the stack monitoring recipe disables TLS to the monitored cluster which is Not Good.
At this time I don't think there's a good reason to keep this issue open. Unless there's objections I'll close it in a few days.