Clickhouse: Bloom Indexing operation causing OOMs
I've enabled a bloom index on an Array(String) column, and I've noticed that because of this I'm seeing extremely high memory usage which is causing Clickhouse (version 19.17.4.11) to OOM.
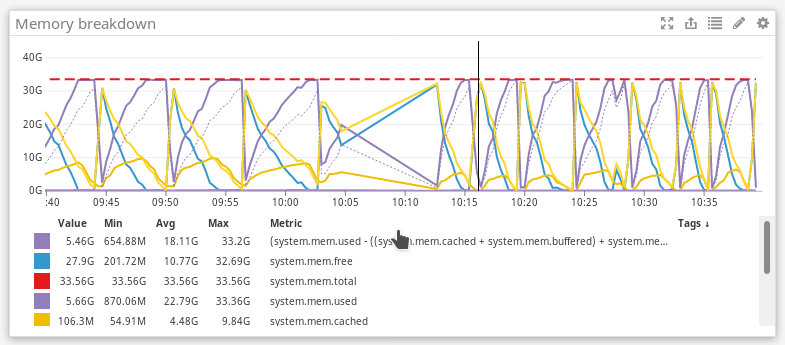
As a result, it looks like there are a whole bunch of merges getting backed and not making progress. Server has 32G of RAM. Using perf, the one of the highest functions shown is DB::BloomFilter::addHashWithSeed which is why I think this is a result of the Bloom index.
metrics_qa :) select database, table, elapsed, progress, num_parts, formatReadableSize(memory_usage) from merges;

SELECT
    database,
    table,
    elapsed,
    progress,
    num_parts,
    formatReadableSize(memory_usage)
FROM merges

┌─database─┬─table──────┬───────elapsed─┬─────────────progress─┬─num_parts─┬─formatReadableSize(memory_usage)─┐
│ default    │ histograms │ 138.927456092 │ 0.009250563257249815 │        12 │ 2.05 GiB                         │
│ default    │ histograms │ 138.861809743 │    0.055173005336291 │        11 │ 2.23 GiB                         │
│ default    │ histograms │ 138.829303978 │  0.05388030194829263 │        13 │ 2.24 GiB                         │
│ default    │ histograms │ 138.759085752 │ 0.011949443797662702 │        16 │ 2.00 GiB                         │
│ default    │ histograms │  138.74322428 │  0.01942913601668529 │        12 │ 2.06 GiB                         │
│ default    │ histograms │ 138.717364362 │ 0.022370385001223802 │        12 │ 2.19 GiB                         │
│ default    │ histograms │ 138.685355371 │  0.03908257269084415 │         8 │ 2.23 GiB                         │
│ default    │ histograms │ 138.649866072 │   0.0982202348644684 │         4 │ 2.38 GiB                         │
│ default    │ histograms │ 138.368147204 │  0.07558041003556983 │         4 │ 1.99 GiB                         │
│ default    │ histograms │ 138.286842186 │  0.04993548174615153 │         5 │ 2.05 GiB                         │
│ default    │ histograms │ 138.251910277 │  0.06261820639570424 │         5 │ 2.20 GiB                         │
│ default    │ histograms │ 138.243255183 │ 0.058333314776566905 │         5 │ 2.15 GiB                         │
│ default    │ histograms │ 138.219877609 │  0.27229364749861407 │        11 │ 2.05 GiB                         │
└──────────┴────────────┴───────────────┴──────────────────────┴───────────┴──────────────────────────────────┘

13 rows in set. Elapsed: 0.046 sec.

metrics_qa :) select database, table, elapsed, progress, num_parts, formatReadableSize(memory_usage) from merges;

SELECT
    database,
    table,
    elapsed,
    progress,
    num_parts,
    formatReadableSize(memory_usage)
FROM merges

┌─database─┬─table──────┬──────elapsed─┬──────────────progress─┬─num_parts─┬─formatReadableSize(memory_usage)─┐
│ default    │ histograms │ 14.460548537 │ 0.0014619944948044384 │        12 │ 599.14 MiB                       │
│ default    │ histograms │ 14.380980342 │  0.010725400336827147 │        11 │ 612.94 MiB                       │
│ default    │ histograms │ 14.373428775 │  0.008424919941005757 │        13 │ 553.63 MiB                       │
│ default    │ histograms │ 14.337396365 │  0.002216634563745533 │        16 │ 614.03 MiB                       │
│ default    │ histograms │ 14.331145173 │ 0.0037643951032327754 │        12 │ 608.00 MiB                       │
│ default    │ histograms │ 14.218492431 │  0.003320279777547132 │        12 │ 535.20 MiB                       │
│ default    │ histograms │ 14.163099015 │   0.00516794349630997 │         8 │ 485.54 MiB                       │
│ default    │ histograms │ 14.133526059 │   0.01824524486646472 │         4 │ 506.90 MiB                       │
│ default    │ histograms │ 14.103848452 │  0.013445953096215605 │         4 │ 457.70 MiB                       │
│ default    │ histograms │ 14.071331435 │   0.01034111655563959 │         5 │ 570.38 MiB                       │
│ default    │ histograms │ 13.857877555 │  0.012459197155920572 │         5 │ 543.93 MiB                       │
│ default    │ histograms │  13.84478482 │  0.008966428243041204 │         5 │ 428.58 MiB                       │
│ default    │ histograms │ 13.820244621 │    0.0316512274015483 │        11 │ 429.94 MiB                       │
└──────────┴────────────┴──────────────┴───────────────────────┴───────────┴──────────────────────────────────┘

13 rows in set. Elapsed: 0.043 sec.

metrics_qa :) select database, table, elapsed, progress, num_parts, formatReadableSize(memory_usage) from merges;

SELECT
    database,
    table,
    elapsed,
    progress,
    num_parts,
    formatReadableSize(memory_usage)
FROM merges

┌─database─┬─table──────┬──────elapsed─┬─────────────progress─┬─num_parts─┬─formatReadableSize(memory_usage)─┐
│ default    │ histograms │ 79.471550264 │ 0.005503541730779245 │        12 │ 1.33 GiB                         │
│ default    │ histograms │ 79.391981317 │  0.03652433628216813 │        11 │ 1.50 GiB                         │
│ default    │ histograms │ 79.384428457 │ 0.034385429061546756 │        13 │ 1.49 GiB                         │
│ default    │ histograms │ 79.348397932 │ 0.008764624022166247 │        16 │ 1.56 GiB                         │
│ default    │ histograms │ 79.342144671 │ 0.013883736778589699 │        12 │ 1.49 GiB                         │
│ default    │ histograms │ 79.229500032 │ 0.016518391893296982 │        12 │ 1.69 GiB                         │
│ default    │ histograms │ 79.174108339 │  0.02235135562154062 │         8 │ 1.35 GiB                         │
│ default    │ histograms │ 79.144535614 │ 0.059905220644892496 │         4 │ 1.46 GiB                         │
│ default    │ histograms │ 79.114858427 │  0.05633146665572432 │         4 │ 1.52 GiB                         │
│ default    │ histograms │ 79.082340708 │ 0.032979777123391125 │         5 │ 1.38 GiB                         │
│ default    │ histograms │ 78.868886937 │  0.04081461137284325 │         5 │ 1.42 GiB                         │
│ default    │ histograms │ 78.855796039 │ 0.035865712972164815 │         5 │ 1.30 GiB                         │
│ default    │ histograms │ 78.831255279 │  0.17175445457604885 │        11 │ 1.45 GiB                         │
└──────────┴────────────┴──────────────┴──────────────────────┴───────────┴──────────────────────────────────┘
 volfco
All 9 comments
Removing the bloom filter index (alter table histograms on cluster metrics_qa drop index tvl_bf;) drops the memory usage massively:
metrics_qa :) select database, table, elapsed, progress*100, num_parts, formatReadableSize(memory_usage) from system.merges;

SELECT
    database,
    table,
    elapsed,
    progress * 100,
    num_parts,
    formatReadableSize(memory_usage)
FROM system.merges

┌─database─┬─table──────┬───────elapsed─┬─multiply(progress, 100)─┬─num_parts─┬─formatReadableSize(memory_usage)─┐
│ default    │ histograms │ 166.999396023 │      12.882290374909966 │        13 │ 266.11 MiB                       │
│ default    │ histograms │ 166.804492109 │      3.7402523443430375 │        16 │ 352.81 MiB                       │
│ default    │ histograms │ 166.726134664 │       80.19551790831188 │         7 │ 161.79 MiB                       │
│ default    │ histograms │ 166.725280153 │      1.2951098841319313 │       282 │ 6.47 GiB                         │
│ default    │ histograms │ 166.716085174 │       66.28287656513143 │         9 │ 199.50 MiB                       │
│ default    │ histograms │ 166.711055506 │      1.3800261116048564 │       243 │ 5.96 GiB                         │
│ default    │ histograms │ 166.686738206 │       65.46335768719369 │         9 │ 190.51 MiB                       │
│ default    │ histograms │ 166.662355568 │       68.70942321198352 │         8 │ 184.57 MiB                       │
│ default    │ histograms │ 166.602394295 │       77.64397661812055 │         7 │ 160.97 MiB                       │
│ default    │ histograms │  166.58240519 │       72.00820582232703 │         6 │ 149.59 MiB                       │
│ default    │ histograms │ 166.482173293 │       66.83028057574408 │         8 │ 176.86 MiB                       │
│ default    │ histograms │ 166.430629511 │       68.56970075887493 │         7 │ 171.74 MiB                       │
│ default    │ histograms │   166.3774191 │       76.39837731533673 │         7 │ 166.11 MiB                       │
└──────────┴────────────┴───────────────┴─────────────────────────┴───────────┴──────────────────────────────────┘

13 rows in set. Elapsed: 0.012 sec.

metrics_qa :)
Show your table definition (CREATE QUERY), please.
 alesapin
on 4 Dec 2019
alesapin
on 4 Dec 2019
CREATE TABLE default.histograms (`Timestamp` DateTime CODEC(DoubleDelta, LZ4), `Client` LowCardinality(String), `Path` LowCardinality(String), `Tags.Key` Array(LowCardinality(String)), `Tags.Value` Array(String) CODEC(LZ4HC(0)), `Range` Array(Float32), `Steps` Float32, `IndexNotation` Int32, `Histogram` Array(Float32)) ENGINE = ReplicatedMergeTree('/clickhouse/tables/histograms/{shard_metrics_qa}', '{replica_metrics_qa}') PARTITION BY toStartOfDay(Timestamp) ORDER BY (Path, Timestamp) TTL Timestamp + toIntervalDay(21) SETTINGS index_granularity = 8192
Is the table schema. This is the index that was added:
alter table slomo.histograms on cluster metrics_qa add index tkv_bf Tags.Value TYPE bloom_filter(0.01) GRANULARITY 8192;
volfco
on 4 Dec 2019
GRANULARITY is too big. Can it be adjusted to 3 or 5? detailed information see: https://github.com/ClickHouse/ClickHouse/issues/7517#issuecomment-549224927
For granularity = 5, bloom filter will build an index for the adjacent 5 granlules data block(one granlule size is specified when creating the MergeTree, the default 8192 row). GRANULARITY = 8192 is too big, which means that one index block has to compute the index information for 8192 * 8192 rows.
 zhang2014
on 5 Dec 2019
zhang2014
on 5 Dec 2019
@zhang2014 Thanks for the information.
I've tried to recreate the OOM situation in my QA cluster and cannot replicate it. It might have just been a perfect storm of pending merges when the overly granular index was applied.
volfco
on 5 Dec 2019
The bloom filter feature of ClickHouse is awesome and very fast to filter rows.
But, I think there are two issues in bloom filter.
GRANULARITYof index doesn't applied.- When merging two bloom filters, it takes too long time. The time complexity of this job may be O(n^3).
making hashes for the elements of an array*the number of arrays*the number of merges.
if you don't mind, I want to try to fix this issues.
Thank you.
 achimbab
on 12 Dec 2019
achimbab
on 12 Dec 2019
@volfco
I am fixing the perfect storm of pending merges at https://github.com/ClickHouse/ClickHouse/pull/8242
Thank you.
achimbab
on 17 Dec 2019
@volfco
Some bugs are fixed at https://github.com/ClickHouse/ClickHouse/pull/8242.
If you are yet interested in the bloom_filter, please retest the perfect storm of pending merges.
And if the result of the test is fine then please close this issue,
Thank you.
achimbab
on 31 Dec 2019
@achimbab I don't have a solid idea of the conditions that existed for this to happen. So let's assume #8242 fixes it and I'll re-open this or link it to a new issue if something like this happens again
volfco
on 31 Dec 2019
Related issues
 vvp83
·
3Comments
vvp83
·
3Comments
 bseng
·
3Comments
bseng
·
3Comments
 zhicwu
·
3Comments
zhicwu
·
3Comments
 amonakhov
·
3Comments
amonakhov
·
3Comments
 jangorecki
·
3Comments
jangorecki
·
3Comments