Clickhouse: Kafka consumer disconnected (no reconnect then) when brokers got imbalanced
I have encountered this in error log today
2019.03.08 21:02:28.282106 [ 89 ] {} <Error> StorageKafka (kafka_source): Consumer error: Local: Broker node update
2019.03.08 21:02:30.283951 [ 47 ] {} <Error> void DB::StorageKafka::streamThread(): std::exception. Code: 1001, type: cppkafka::HandleException, e.what() = Local: Invalid argument or configuration
2019.03.08 21:06:37.267775 [ 869 ] {} <Error> StorageKafka (kafka_source): Consumer error: Broker: Group coordinator load in progress
2019.03.08 21:07:05.347050 [ 39 ] {} <Error> void DB::StorageKafka::streamThread(): std::exception. Code: 1001, type: cppkafka::HandleException, e.what() = Local: Invalid argument or configuration
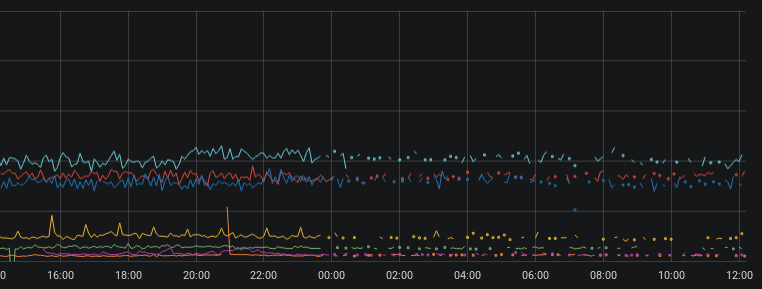
Since then the consumer did not reconnect and consumed no message.I had to drop the Kafka Engine table and create it again. Then it started.
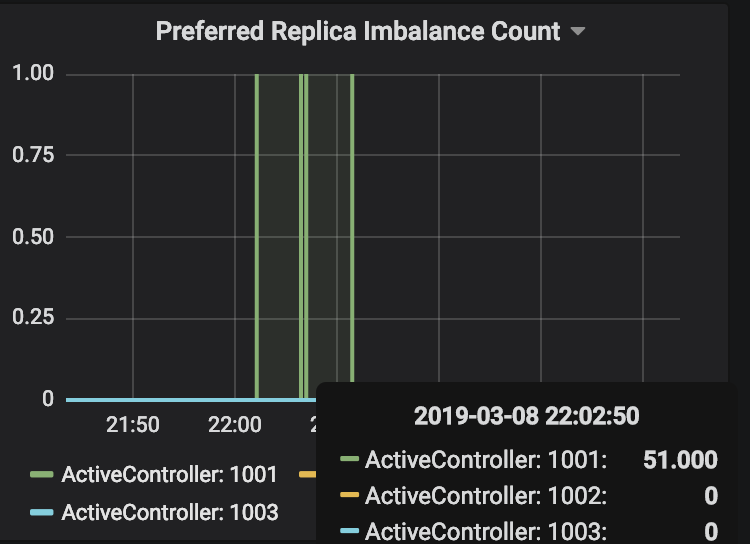
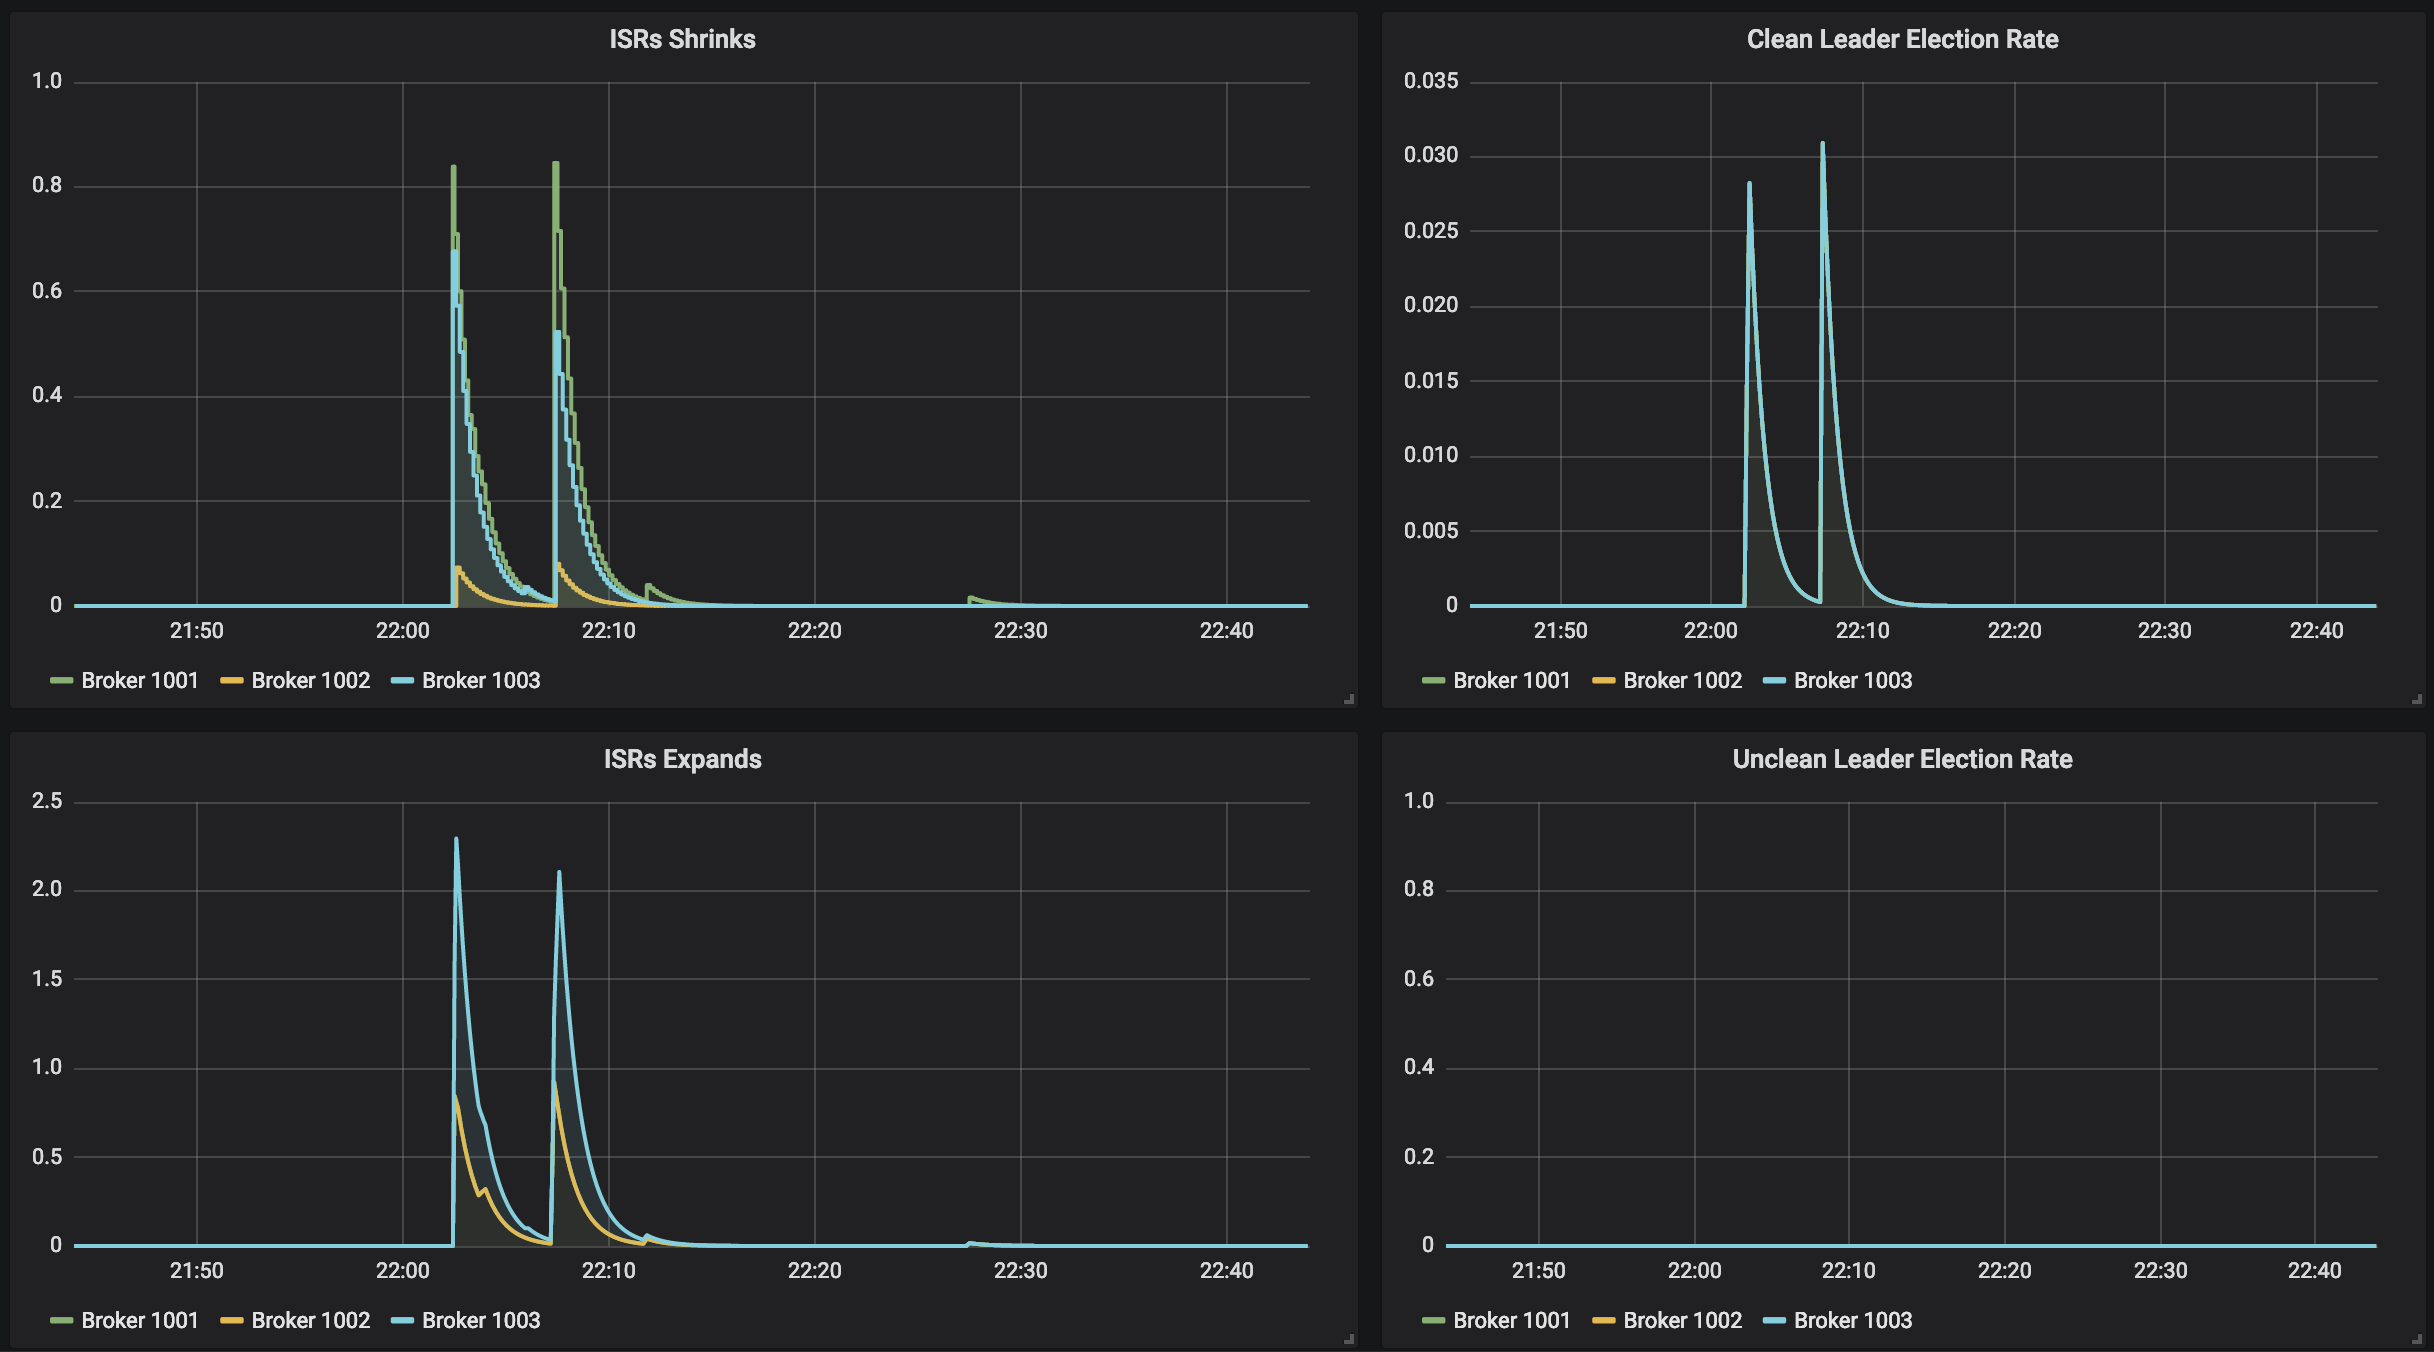
At that time, something happened in my cluster but it's up and running. (graphs are in UTC+1)
Any ideas?
 simPod
All 35 comments
I may be seeing a similar issue, where one or two nodes in a four node cluster, all consuming from the same group fall behind. Only a DROP/CREATE of the Kafka table consumers seems to bring things back in sync for a time.
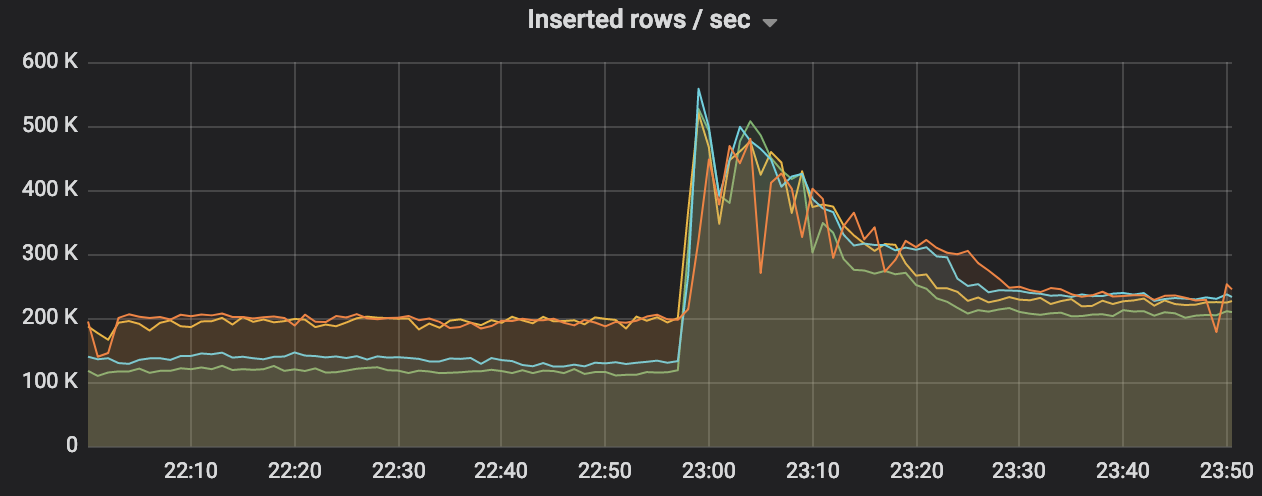
In this chart, the left side shows the imbalance in rate, the peak near 2300 is when the consumers in ClickHouse are recreated, and right side shows expected state:
 kmatt
on 10 Mar 2019
kmatt
on 10 Mar 2019
This night it took 4:30h until it auto recovered.

simPod
on 10 Mar 2019
Another observations showed that the time period when the lag is increasing has random length.
simPod
on 11 Mar 2019
Any suggestions on how to diagnose this issue, or where the problem may lie (v19.3.5)?
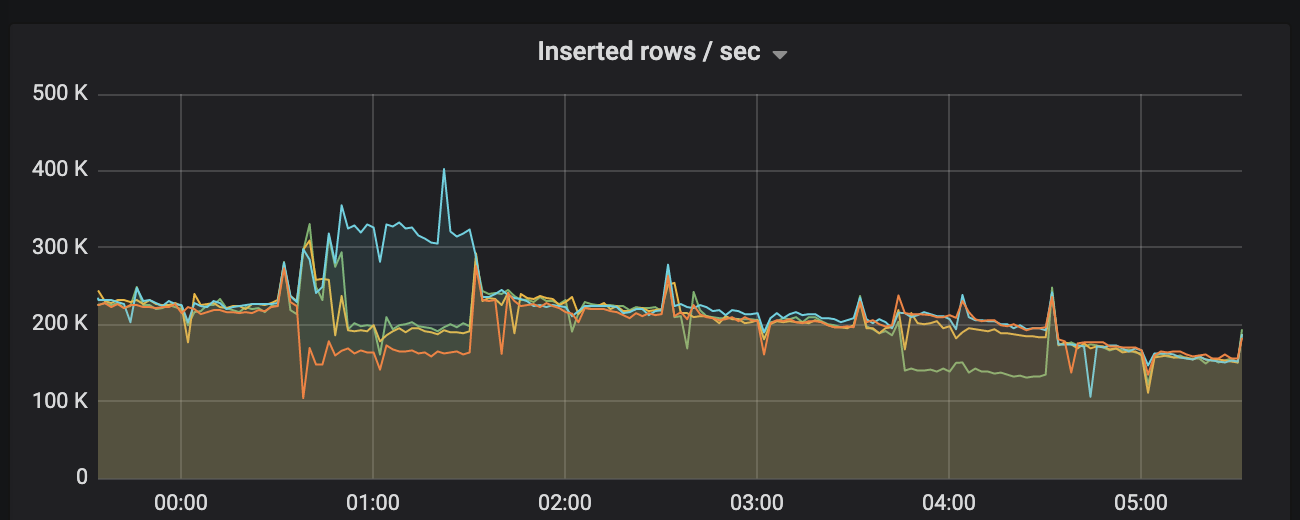
In this example consumer tables are dropped and recreated at 30 minutes past every hour, which brings all nodes back to a similar consumption rate, but it typically falls off again.
kmatt
on 21 Mar 2019
There was no issue on my side for a while but it appeared just now. Meanwhile I tried upgrading to 19.4.1.3 where librdkafka is at v1 RC8 but it's happening there too. For now I have no clue what the cause might be.
simPod
on 21 Mar 2019
I got same error void DB::StorageKafka::streamThread(): std::exception. Code: 1001, type: cppkafka::HandleException, e.what() = Local: Invalid argument or configuration. Drop Kakfa engine table and recreate help. ClickHouse server version 19.3.7
 Junus
on 22 Mar 2019
Junus
on 22 Mar 2019
@kmatt 👋 you wrote this
Testing with message size and reconnect parameters to librdkafka is showing some improvements in my case:

<kafka>
  <fetch_max_bytes>104857600</fetch_max_bytes>
  <fetch_message_max_bytes>104857600</fetch_message_max_bytes>
  <receive_message_max_bytes>105000000</receive_message_max_bytes>
  <reconnect_backoff_ms>5000</reconnect_backoff_ms>
  <reconnect_backoff_max_ms>60000</reconnect_backoff_max_ms>
</kafka>
In the last 24 hours my consumption rates have remained balanced across the 4 node cluster.
I suppose the test was unsucessful? :)
simPod
on 31 Mar 2019
@simPod Correct - behavior returned shortly after I posted that message. Still looking at librdkafka parameters, currently heartbeat and timeout.
kmatt
on 1 Apr 2019
It is related to under-replicated partitions I believe

It started the same time the unde rreplication occurred
simPod
on 2 Apr 2019
Shouldn't we have rebalance cb?
@vavrusa you have implemented Kafka engine. If I may ask, is it forgotten or there's a reason for it not to be present in ClickHouse code? Thanks!
simPod
on 2 Apr 2019
But maybe it's implemented through cppkafka https://github.com/mfontanini/cppkafka/blob/4a887607b356eeef715306d442242d3a8d55c13e/src/consumer.cpp#L316
simPod
on 2 Apr 2019
We encountered the same issue and we experienced some data loss around the time of disconnection.
 matthew-formosa-gig
on 11 Apr 2019
matthew-formosa-gig
on 11 Apr 2019
Please, increase the verbosity of rdkafka in server config:
<kafka>
    <debug>all</debug>
</kafka>
And provide me logs when the issue happens. So I can understand what is really happening from the client point of view.
 abyss7
on 16 May 2019
abyss7
on 16 May 2019
I had to stabilize production solution so I dropped all kafka engine consumers, replaced by java consumer-inserters. Unfortunately, I can no longer help with this then 😞
simPod
on 19 May 2019
I updated CH from 19.5.3.8 to 19.6.2.11 and at the same time i cleaned some kafka related table manualy because drop didnt work. May be different case but then I got same error with these config settings;
<kafka>
       <max_poll_interval_ms>60000</max_poll_interval_ms>
       <session_timeout_ms>60000</session_timeout_ms>
       <heartbeat_interval_ms>10000</heartbeat_interval_ms>
       <reconnect_backoff_ms>5000</reconnect_backoff_ms>
       <reconnect_backoff_max_ms>60000</reconnect_backoff_max_ms>
    </kafka>
void DB::StorageKafka::streamThread(): std::exception. Code: 1001, type: cppkafka::HandleException, e.what() = Local: Invalid argument or configuration, version = 19.6.2.11 (official build)
with these lines
2019.05.22 09:39:53.839818 [ 26 ] {} <Trace> StorageKafka (udpLogs): Re-joining claimed consumer after failure
2019.05.22 09:39:53.839903 [ 26 ] {} <Trace> StorageKafka (udpLogs): Re-joining claimed consumer after failure
2019.05.22 09:39:53.840067 [ 26 ] {} <Trace> StorageKafka (udpLogs): Re-joining claimed consumer after failure
2019.05.22 09:39:53.840203 [ 26 ] {} <Trace> StorageKafka (udpLogs): Re-joining claimed consumer after failure
2019.05.22 09:39:53.840362 [ 26 ] {} <Trace> StorageKafka (udpLogs): Re-joining claimed consumer after failure
2019.05.22 09:39:53.840457 [ 26 ] {} <Trace> StorageKafka (udpLogs): Re-joining claimed consumer after failure
2019.05.22 09:39:53.840534 [ 26 ] {} <Trace> StorageKafka (udpLogs): Re-joining claimed consumer after failure
2019.05.22 09:39:53.840620 [ 26 ] {} <Trace> StorageKafka (udpLogs): Re-joining claimed consumer after failure
2019.05.22 09:39:53.840729 [ 26 ] {} <Trace> StorageKafka (udpLogs): Re-joining claimed consumer after failure
2019.05.22 09:39:53.840790 [ 26 ] {} <Trace> StorageKafka (udpLogs): Re-joining claimed consumer after failure
2019.05.22 09:39:53.840949 [ 26 ] {} <Trace> StorageKafka (udpLogs): Re-joining claimed consumer after failure
2019.05.22 09:39:53.841043 [ 26 ] {} <Trace> StorageKafka (udpLogs): Re-joining claimed consumer after failure
2019.05.22 09:39:53.841133 [ 26 ] {} <Trace> StorageKafka (udpLogs): Re-joining claimed consumer after failure
2019.05.22 09:39:53.841257 [ 26 ] {} <Trace> StorageKafka (udpLogs): Re-joining claimed consumer after failure
2019.05.22 09:39:53.841417 [ 26 ] {} <Trace> StorageKafka (udpLogs): Re-joining claimed consumer after failure
2019.05.22 09:39:53.841582 [ 26 ] {} <Trace> StorageKafka (udpLogs): Re-joining claimed consumer after failure
and set <debug>all</debug> but i did not notice any difference in the logs.
The syslogs contains the logs below;
May 22 09:38:10 bigdata22 clickhouse-server[29851]: %5|1558507090.764|REQTMOUT|ClickHouse 19.6.2.11#consumer-3| [thrd:GroupCoordinator]: GroupCoordinator/8: Timed out LeaveGroupRequest in flight (after 5043ms, timeout #0): possibly held back by preceeding blocking JoinGroupRequest with timeout in 57453ms
May 22 09:38:10 bigdata22 clickhouse-server[29851]: %4|1558507090.765|REQTMOUT|ClickHouse 19.6.2.11#consumer-3| [thrd:GroupCoordinator]: GroupCoordinator/8: Timed out 1 in-flight, 0 retry-queued, 0 out-queue, 0 partially-sent requests
May 22 09:38:10 bigdata22 clickhouse-server[29851]: %3|1558507090.766|FAIL|ClickHouse 19.6.2.11#consumer-3| [thrd:GroupCoordinator]: GroupCoordinator: 1 request(s) timed out: disconnect (after 6007ms in state UP)
May 22 09:38:10 bigdata22 clickhouse-server[29851]: %3|1558507090.766|ERROR|ClickHouse 19.6.2.11#consumer-3| [thrd:GroupCoordinator]: GroupCoordinator: 1 request(s) timed out: disconnect (after 6007ms in state UP)
May 22 09:38:10 bigdata22 clickhouse-server[29851]: %5|1558507090.914|REQTMOUT|ClickHouse 19.6.2.11#consumer-1| [thrd:GroupCoordinator]: GroupCoordinator/8: Timed out LeaveGroupRequest in flight (after 5191ms, timeout #0): possibly held back by preceeding blocking JoinGroupRequest with timeout in 56618ms
May 22 09:38:10 bigdata22 clickhouse-server[29851]: %4|1558507090.915|REQTMOUT|ClickHouse 19.6.2.11#consumer-1| [thrd:GroupCoordinator]: GroupCoordinator/8: Timed out 1 in-flight, 0 retry-queued, 0 out-queue, 0 partially-sent requests
May 22 09:38:10 bigdata22 clickhouse-server[29851]: %3|1558507090.915|FAIL|ClickHouse 19.6.2.11#consumer-1| [thrd:GroupCoordinator]: GroupCoordinator: 1 request(s) timed out: disconnect (after 7007ms in state UP)
May 22 09:38:10 bigdata22 clickhouse-server[29851]: %3|1558507090.916|ERROR|ClickHouse 19.6.2.11#consumer-1| [thrd:GroupCoordinator]: GroupCoordinator: 1 request(s) timed out: disconnect (after 7007ms in state UP)
May 22 09:38:11 bigdata22 snmpd[10470]: Connection from UDP: [213.155.98.45]:64970->[10.58.0.67]:161
May 22 09:38:11 bigdata22 clickhouse-server[29851]: %5|1558507091.325|REQTMOUT|ClickHouse 19.6.2.11#consumer-16| [thrd:GroupCoordinator]: GroupCoordinator/8: Timed out LeaveGroupRequest in flight (after 5602ms, timeout #0): possibly held back by preceeding blocking JoinGroupRequest with timeout in 56209ms
May 22 09:38:11 bigdata22 clickhouse-server[29851]: %4|1558507091.325|REQTMOUT|ClickHouse 19.6.2.11#consumer-16| [thrd:GroupCoordinator]: GroupCoordinator/8: Timed out 1 in-flight, 0 retry-queued, 0 out-queue, 0 partially-sent requests
May 22 09:38:11 bigdata22 clickhouse-server[29851]: %3|1558507091.325|FAIL|ClickHouse 19.6.2.11#consumer-16| [thrd:GroupCoordinator]: GroupCoordinator: 1 request(s) timed out: disconnect (after 7008ms in state UP)
May 22 09:38:11 bigdata22 clickhouse-server[29851]: %3|1558507091.325|ERROR|ClickHouse 19.6.2.11#consumer-16| [thrd:GroupCoordinator]: GroupCoordinator: 1 request(s) timed out: disconnect (after 7008ms in state UP)
May 22 09:38:11 bigdata22 clickhouse-server[29851]: %5|1558507091.664|REQTMOUT|ClickHouse 19.6.2.11#consumer-14| [thrd:GroupCoordinator]: GroupCoordinator/8: Timed out LeaveGroupRequest in flight (after 5944ms, timeout #0): possibly held back by preceeding blocking JoinGroupRequest with timeout in 54867ms
May 22 09:38:11 bigdata22 clickhouse-server[29851]: %4|1558507091.664|REQTMOUT|ClickHouse 19.6.2.11#consumer-14| [thrd:GroupCoordinator]: GroupCoordinator/8: Timed out 1 in-flight, 0 retry-queued, 0 out-queue, 0 partially-sent requests
May 22 09:38:11 bigdata22 clickhouse-server[29851]: %3|1558507091.664|FAIL|ClickHouse 19.6.2.11#consumer-14| [thrd:GroupCoordinator]: GroupCoordinator: 1 request(s) timed out: disconnect (after 9009ms in state UP)
May 22 09:38:11 bigdata22 clickhouse-server[29851]: %3|1558507091.664|ERROR|ClickHouse 19.6.2.11#consumer-14| [thrd:GroupCoordinator]: GroupCoordinator: 1 request(s) timed out: disconnect (after 9009ms in state UP)
 vezir
on 22 May 2019
vezir
on 22 May 2019
I changed my kafka related settings with;
<kafka>
       <fetch_max_bytes>104857600</fetch_max_bytes>
       <fetch_message_max_bytes>104857600</fetch_message_max_bytes>
       <receive_message_max_bytes>105000000</receive_message_max_bytes>
       <max_poll_interval_ms>300000</max_poll_interval_ms>
       <session_timeout_ms>10000</session_timeout_ms>
       <heartbeat_interval_ms>3000</heartbeat_interval_ms>
       <reconnect_backoff_ms>5000</reconnect_backoff_ms>
       <reconnect_backoff_max_ms>60000</reconnect_backoff_max_ms>
    </kafka>
and restart CH and it works now. If any error occurs i ll let you know.
vezir
on 22 May 2019
Hi, the error occured again.
the logs are below;
May 22 11:09:34 bigdata22 clickhouse-server[31808]: %5|1558512574.943|REQTMOUT|ClickHouse 19.6.2.11#consumer-15| [thrd:GroupCoordinator]: GroupCoordinator/8: Timed out LeaveGroupRequest in flight (after 5220ms, timeout #0): possibly held back by preceeding blocking JoinGroupRequest with timeout in 296462ms
May 22 11:09:34 bigdata22 clickhouse-server[31808]: %4|1558512574.943|REQTMOUT|ClickHouse 19.6.2.11#consumer-15| [thrd:GroupCoordinator]: GroupCoordinator/8: Timed out 1 in-flight, 0 retry-queued, 0 out-queue, 0 partially-sent requests
May 22 11:09:34 bigdata22 clickhouse-server[31808]: %3|1558512574.944|FAIL|ClickHouse 19.6.2.11#consumer-15| [thrd:GroupCoordinator]: GroupCoordinator: 1 request(s) timed out: disconnect (after 9010ms in state UP)
May 22 11:09:34 bigdata22 clickhouse-server[31808]: %3|1558512574.944|ERROR|ClickHouse 19.6.2.11#consumer-15| [thrd:GroupCoordinator]: GroupCoordinator: 1 request(s) timed out: disconnect (after 9010ms in state UP)
May 22 11:09:35 bigdata22 clickhouse-server[31808]: %5|1558512575.419|REQTMOUT|ClickHouse 19.6.2.11#consumer-8| [thrd:GroupCoordinator]: GroupCoordinator/8: Timed out LeaveGroupRequest in flight (after 5695ms, timeout #0): possibly held back by preceeding blocking JoinGroupRequest with timeout in 291800ms
May 22 11:09:35 bigdata22 clickhouse-server[31808]: %4|1558512575.419|REQTMOUT|ClickHouse 19.6.2.11#consumer-8| [thrd:GroupCoordinator]: GroupCoordinator/8: Timed out 1 in-flight, 0 retry-queued, 0 out-queue, 0 partially-sent requests
May 22 11:09:35 bigdata22 clickhouse-server[31808]: %3|1558512575.419|FAIL|ClickHouse 19.6.2.11#consumer-8| [thrd:GroupCoordinator]: GroupCoordinator: 1 request(s) timed out: disconnect (after 31032ms in state UP)
May 22 11:09:35 bigdata22 clickhouse-server[31808]: %3|1558512575.419|ERROR|ClickHouse 19.6.2.11#consumer-8| [thrd:GroupCoordinator]: GroupCoordinator: 1 request(s) timed out: disconnect (after 31032ms in state UP)
May 22 11:09:35 bigdata22 clickhouse-server[31808]: %5|1558512575.429|REQTMOUT|ClickHouse 19.6.2.11#consumer-5| [thrd:GroupCoordinator]: GroupCoordinator/8: Timed out LeaveGroupRequest in flight (after 5705ms, timeout #0): possibly held back by preceeding blocking JoinGroupRequest with timeout in 291790ms
May 22 11:09:35 bigdata22 clickhouse-server[31808]: %4|1558512575.429|REQTMOUT|ClickHouse 19.6.2.11#consumer-5| [thrd:GroupCoordinator]: GroupCoordinator/8: Timed out 1 in-flight, 0 retry-queued, 0 out-queue, 0 partially-sent requests
May 22 11:09:35 bigdata22 clickhouse-server[31808]: %3|1558512575.429|FAIL|ClickHouse 19.6.2.11#consumer-5| [thrd:GroupCoordinator]: GroupCoordinator: 1 request(s) timed out: disconnect (after 15014ms in state UP)
May 22 11:09:35 bigdata22 clickhouse-server[31808]: %3|1558512575.429|ERROR|ClickHouse 19.6.2.11#consumer-5| [thrd:GroupCoordinator]: GroupCoordinator: 1 request(s) timed out: disconnect (after 15014ms in state UP)
May 22 11:09:35 bigdata22 clickhouse-server[31808]: %5|1558512575.502|REQTMOUT|ClickHouse 19.6.2.11#consumer-24| [thrd:GroupCoordinator]: GroupCoordinator/8: Timed out LeaveGroupRequest in flight (after 5779ms, timeout #0): possibly held back by preceeding blocking JoinGroupRequest with timeout in 291717ms
May 22 11:09:35 bigdata22 clickhouse-server[31808]: %4|1558512575.502|REQTMOUT|ClickHouse 19.6.2.11#consumer-24| [thrd:GroupCoordinator]: GroupCoordinator/8: Timed out 1 in-flight, 0 retry-queued, 0 out-queue, 0 partially-sent requests
May 22 11:09:35 bigdata22 clickhouse-server[31808]: %3|1558512575.502|FAIL|ClickHouse 19.6.2.11#consumer-24| [thrd:GroupCoordinator]: GroupCoordinator: 1 request(s) timed out: disconnect (after 16017ms in state UP)
May 22 11:09:35 bigdata22 clickhouse-server[31808]: %3|1558512575.502|ERROR|ClickHouse 19.6.2.11#consumer-24| [thrd:GroupCoordinator]: GroupCoordinator: 1 request(s) timed out: disconnect (after 16017ms in state UP)
May 22 11:09:35 bigdata22 clickhouse-server[31808]: %5|1558512575.520|REQTMOUT|ClickHouse 19.6.2.11#consumer-10| [thrd:GroupCoordinator]: GroupCoordinator/8: Timed out LeaveGroupRequest in flight (after 5796ms, timeout #0): possibly held back by preceeding blocking JoinGroupRequest with timeout in 293885ms
May 22 11:09:35 bigdata22 clickhouse-server[31808]: %4|1558512575.521|REQTMOUT|ClickHouse 19.6.2.11#consumer-10| [thrd:GroupCoordinator]: GroupCoordinator/8: Timed out 1 in-flight, 0 retry-queued, 0 out-queue, 0 partially-sent requests
May 22 11:09:35 bigdata22 clickhouse-server[31808]: %3|1558512575.521|FAIL|ClickHouse 19.6.2.11#consumer-10| [thrd:GroupCoordinator]: GroupCoordinator: 1 request(s) timed out: disconnect (after 10011ms in state UP)
May 22 11:09:35 bigdata22 clickhouse-server[31808]: %3|1558512575.521|ERROR|ClickHouse 19.6.2.11#consumer-10| [thrd:GroupCoordinator]: GroupCoordinator: 1 request(s) timed out: disconnect (after 10011ms in state UP)
May 22 11:09:35 bigdata22 clickhouse-server[31808]: %5|1558512575.642|REQTMOUT|ClickHouse 19.6.2.11#consumer-26| [thrd:GroupCoordinator]: GroupCoordinator/8: Timed out LeaveGroupRequest in flight (after 5918ms, timeout #0): possibly held back by preceeding blocking JoinGroupRequest with timeout in 291577ms
May 22 11:09:35 bigdata22 clickhouse-server[31808]: %4|1558512575.642|REQTMOUT|ClickHouse 19.6.2.11#consumer-26| [thrd:GroupCoordinator]: GroupCoordinator/8: Timed out 1 in-flight, 0 retry-queued, 0 out-queue, 0 partially-sent requests
May 22 11:09:35 bigdata22 clickhouse-server[31808]: %3|1558512575.643|FAIL|ClickHouse 19.6.2.11#consumer-26| [thrd:GroupCoordinator]: GroupCoordinator: 1 request(s) timed out: disconnect (after 21022ms in state UP)
May 22 11:09:35 bigdata22 clickhouse-server[31808]: %3|1558512575.643|ERROR|ClickHouse 19.6.2.11#consumer-26| [thrd:GroupCoordinator]: GroupCoordinator: 1 request(s) timed out: disconnect (after 21022ms in state UP
vezir
on 22 May 2019
I removed the kafka parameters from the config.xml and redefine the create table statement with kafka engine with these parameters;
kafka_num_consumers = 4,
kafka_row_delimiter = '\n',
kafka_skip_broken_messages = 1,
kafka_max_block_size = 1000;
Now, It seems ok. I am monitoring.
vezir
on 22 May 2019
try adding following config to your kafka brokers group.initial.rebalance.delay.ms=0 This would possibly sort out errors like
[thrd:GroupCoordinator]: GroupCoordinator/2: Timed out LeaveGroupRequest in flight (after 5940ms, timeout #0): possibly held back by preceeding blocking JoinGroupRequest with timeout in 86395669ms
[thrd:GroupCoordinator]: GroupCoordinator/2: Timed out 1 in-flight, 0 retry-queued, 0 out-queue, 0 partially-sent requests
Update: No, error still remains.
Update: Not a solution but for our case we ended up reducing number of consumers to 1, just to avoid GroupRequest errors.
 hasnat
on 28 May 2019
hasnat
on 28 May 2019
Can you tell if the initial number of consumers (kafka_num_consumers) exceeds at any point of time the total number of partitions for all consumed topics?
abyss7
on 3 Jun 2019
Can you tell if the initial number of consumers (
kafka_num_consumers) exceeds at any point of time the total number of partitions for all consumed topics?
@abyss7
No before it was setup as 3 consumers for a 3 partitions topic
We have another 8 consumers table on 8 partitions topic which never gave us any trouble.
only difference is for clickhouse 8/8 is on local network and 3/3 is different continent.
hasnat
on 3 Jun 2019
I removed the kafka parameters from the config.xml and redefine the create table statement with kafka engine with these parameters;
kafka_num_consumers = 4, kafka_row_delimiter = '\n', kafka_skip_broken_messages = 1, kafka_max_block_size = 1000;Now, It seems ok. I am monitoring.
I have applied the same configuration with @vezir . I need to monitor as well if this configuration is correct.
 spyros87
on 7 Jun 2019
spyros87
on 7 Jun 2019
For our config, it started to work smoothly again when we reduced the number of kafka_num_consumers to 1 .
spyros87
on 12 Jun 2019
@spyros87 how many partitions your topic have?
We are probably facing same issue, I have set kafka_num_consumers to match number of partitions(2), but after ~9h clickhouse stopped reading one of the topics - again(increasing LAG on one partition).
Problem introduced with upgrade from v18.12.17 to v19.7.3.9, we are running on v19.7.5.27 right now.
I will also try to set kafka_num_consumers to 1
Strange thing is also reality, that kafka client is not reading partition 1(according to increasing LAG), but LAG on partition 0 stay low(messages are commited in kafka) - but data are not actually written to clickhouse :/ according to graph we are missing data(after I have set kafka_num_consumers to 1 and partition 1 was read)
 splichy
on 13 Jun 2019
splichy
on 13 Jun 2019
@abyss7 including kafka debug log
kafka_consumer_group_describe_20190613_1150__01.log
kafka_debug_log_20190613_1150__01.log
splichy
on 13 Jun 2019
@abyss7 the issue reproduces on version 19.7.3.9 with kafka_num_consumers = 1
 eupakhomov
on 14 Jun 2019
eupakhomov
on 14 Jun 2019
We are probably facing same issue, I have set kafka_num_consumers to match number of partitions(2)
You should always set the kafka_num_consumers to be lower than the number_of_kafka_partitions / number_of_clickhouse_nodes. If your Kafka topic has 10 partitions for example and you have 2 clickhouse nodes, you shouldn't set it to more than 5 because one node may get more partitions assigned than the other one. Normally you don't really need to change the kafka_num_consumers setting unless your write throughput is in hundreds of thousands records per second.
I removed the kafka parameters from the config.xml and redefine the create table statement with kafka engine with these parameters; kafka_num_consumers = 4, kafka_row_delimiter = '\n', kafka_skip_broken_messages = 1, ...
See the https://github.com/yandex/ClickHouse/issues/5545#issuecomment-502141729 for kafka_skip_broken_messages setting.
I would be wary of fiddling with Kafka client timeouts, at least make sure that the various I/O timeouts can't exceed the session or rebalance timer, otherwise groups will have difficulty forming. If you have a high latency connection to Kafka or slow Kafka cluster, then it could help to increase some timeouts. The Kafka engine with a view attached to it will try to commit at most every stream_flush_interval_ms https://github.com/yandex/ClickHouse/blob/master/dbms/src/Core/Settings.h#L209 which is 7.5s by default. It must complete the commit within the rebalance or session timeout. I think the query execution only checks the limits on every block, so every max_block_size rows or EOF (actually this was updated in https://github.com/yandex/ClickHouse/commit/4a5832b18ad00af7bdb62bb0577d726887bf17e7 it seems). But anyway, the commit interval must be lower than the Kafka session timeouts. It would be perhaps better to implement rebalance_cb as @simPod suggested and cancel any pending queries if rebalance request comes in to force them to wrap up as soon as possible instead of relying on timers.
 vavrusa
on 14 Jun 2019
vavrusa
on 14 Jun 2019
Hi, still happening even with kafka_skip_broken_messages=1 & kafka_num_consumers=1.
We have only standalone clickhouse instances(one for "production" and second for tests) each instance uses it's own Consumer Group. Topic is on 3 node kafka cluster, in 2 partitions.
Issue is on both CH instances. We are actually reading from multiple kafka clusters, but it looks that it happening with topics on remote kafka clusters(different country) with higher msg. rates.
So:
both CH independet instances are at Frankfurt
high msg. rate topic at FRA - OK(but didn't mean that issue cannot happen later)
high msg. rate topic at Prague - problem(stops reading after a few hours, but on both CH servers it stoped at different time)
low msg. rate topic at Prague - OK(at least didnt stoping after a few hours)
Yesterday CH stopped reading at 16:35:35, on second CH ~2h earlier
kafka_debug_log_20190618_1635_.log
splichy
on 19 Jun 2019
Looks like #5680 . Is there a deadline for the decision? This is a critical problem.
 k0st1an
on 25 Jun 2019
k0st1an
on 25 Jun 2019
I have upgraded rdkafka library (as a suggested solution to #5680) in v19.11+ - since I still can't reproduce an issue, I would appreciate if someone will test 19.11 before it gets stable.
abyss7
on 1 Jul 2019
I got same error
void DB::StorageKafka::streamThread(): std::exception. Code: 1001, type: cppkafka::HandleException, e.what() = Local: Invalid argument or configuration. Drop Kakfa engine table and recreate help. ClickHouse server version 19.3.7
 florida-hehe
on 18 Jul 2019
florida-hehe
on 18 Jul 2019
@florida-hehe can you please try to reproduce that on 19.11.7?
 filimonov
on 19 Jul 2019
filimonov
on 19 Jul 2019
This issue has been automatically marked as stale because it has not had recent activity. It will be closed if no further activity occurs. Thank you for your contributions.
![stale[bot] picture](https://avatars3.githubusercontent.com/in/1724?v=4&s=40) stale[bot]
on 20 Oct 2019
stale[bot]
on 20 Oct 2019
Obsolete. If you see some of the problems discussed here on new versions please open new issue.
filimonov
on 29 May 2020
I also encountered the same problem, what is the final solution? What caused it?
 MrSsunlight
on 10 Jun 2020
MrSsunlight
on 10 Jun 2020
Related issues
 derekperkins
·
3Comments
derekperkins
·
3Comments
 jangorecki
·
3Comments
jangorecki
·
3Comments
 vvp83
·
3Comments
vvp83
·
3Comments
 fizerkhan
·
3Comments
fizerkhan
·
3Comments
 opavader
·
3Comments
opavader
·
3Comments
Most helpful comment
I have upgraded rdkafka library (as a suggested solution to #5680) in v19.11+ - since I still can't reproduce an issue, I would appreciate if someone will test 19.11 before it gets stable.