Chromeless: How to measure web page load time?
Hello everyone,
is possible to measure the webpage load time? If yes, any suggestions?
 pmcalabrese
All 8 comments
You can do this on your side with Date.now() before running your script (does add in some latency due to WS events)
const { Chromeless } = require('chromeless');
const chrome = new Chromeless();
const start = Date.now();

chrome.goto('https://www.google.com').then(() => { console.log(`Time: ${Date.now() - start}` })
 joelgriffith
on 4 Aug 2017
joelgriffith
on 4 Aug 2017
@joelgriffith no that wont work
I've come up with this, which is in somehow ok, but the load time is bit less then what I can read in network tab in Chrome, might this be due to some page rendering missing?
const { Chromeless } = require('chromeless');
const _ = require('lodash');
const URL = 'https://www.google.dk';
const ATTEMPT = 5;
const REMOVE_COLD_START = false;

async function run() {
  const chromeless = new Chromeless({ remote: false });
  let load_times = [];

  for (var index = 0; index < ATTEMPT; index++) {
    const navigate_time = await chromeless
      .goto(URL)
      .then(() => {
        return Date.now()
      })
      .catch(console.error.bind(console))

    const page_ready_time = await chromeless
      // .type('chromeless', 'input[name="q"]')
      // .press(13)
      .wait('body')
      .evaluate(() => {
        return Date.now()
      });

    load_times.push(page_ready_time - navigate_time);
  }

  if (REMOVE_COLD_START) {
    load_times = load_times.splice(1);
  }

  console.log(load_times);
  console.log("avarage", _.mean(load_times));
  console.log("min", _.min(load_times));
  console.log("max", _.max(load_times));

  await chromeless.end().then(() => {
    console.log("chorme is ended");
  });
}

run().catch(console.error.bind(console))
You could just use Navigation Timing API, this gives you milliseconds precision and doesn't rely on any specific framework.
Just load the page and fetch the object see demo:
const chromeless = new Chromeless({ remote: true })

const performance = await chromeless
  .goto('https://www.graph.cool')
  .scrollTo(0, 2000)
  .evaluate(()=>{return JSON.stringify(window.performance.timing, null,'\t')})

console.log(performance);

await chromeless.end()
returns
{
    "navigationStart": 1502099699086,
    "unloadEventStart": 0,
    "unloadEventEnd": 0,
    "redirectStart": 0,
    "redirectEnd": 0,
    "fetchStart": 1502099699086,
    "domainLookupStart": 1502099699086,
    "domainLookupEnd": 1502099699145,
    "connectStart": 1502099699145,
    "connectEnd": 1502099699152,
    "secureConnectionStart": 1502099699146,
    "requestStart": 1502099699152,
    "responseStart": 1502099699154,
    "responseEnd": 1502099699176,
    "domLoading": 1502099699166,
    "domInteractive": 1502099701206,
    "domContentLoadedEventStart": 1502099701206,
    "domContentLoadedEventEnd": 1502099701231,
    "domComplete": 1502099701748,
    "loadEventStart": 1502099701749,
    "loadEventEnd": 1502099701750
}
 aml11
on 7 Aug 2017
aml11
on 7 Aug 2017
@aml11 excellent thank you.
I believe loadEventEnd - navigationStart should be the entire page load time interval, agree?
pmcalabrese
on 7 Aug 2017
I suppose, you can see a nice chart in the spec
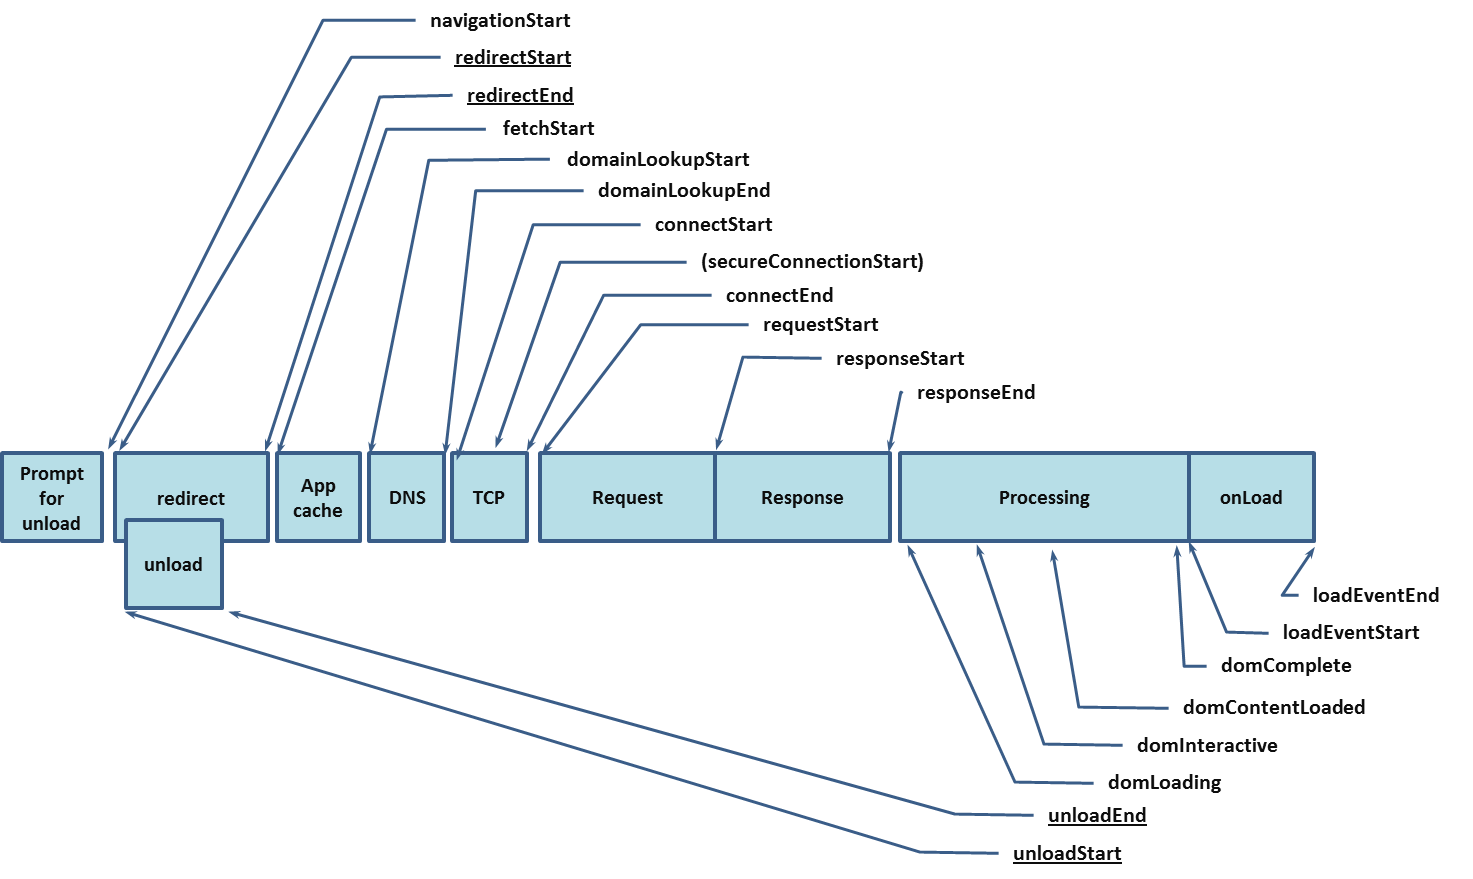
Really depends what you are trying to measure (do you care about transport?)
aml11
on 7 Aug 2017
@aml11 Love this graph! 👍 Test are running in different regions so, I actually do.
pmcalabrese
on 7 Aug 2017
Happy to help
aml11
on 7 Aug 2017
Very cool chart! I'm going to close this as it seems that you've landed on a decent pattern. Thanks!
joelgriffith
on 7 Aug 2017
Related issues
 just-boris
·
5Comments
just-boris
·
5Comments
 stevenvachon
·
4Comments
stevenvachon
·
4Comments
 seangransee
·
5Comments
seangransee
·
5Comments
 devfordays
·
3Comments
devfordays
·
3Comments
 eitansela
·
4Comments
eitansela
·
4Comments
Most helpful comment
I suppose, you can see a nice chart in the spec

Really depends what you are trying to measure (do you care about transport?)