Che: Occasionally, workspace start / stop will hang for minutes before workspace async start / stop is scheduled
Describe the bug
We've seen severe slowdowns in workspace starts lasting around 30 minutes to an hour. E.g., looking at jaeger traces:
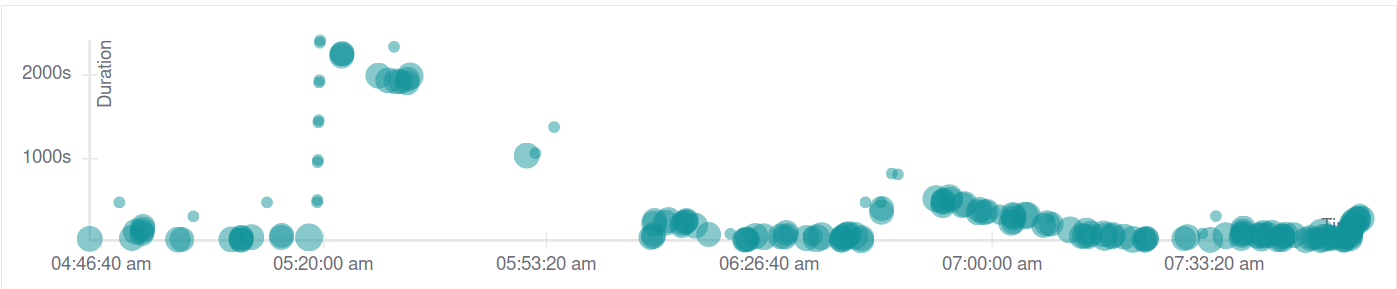
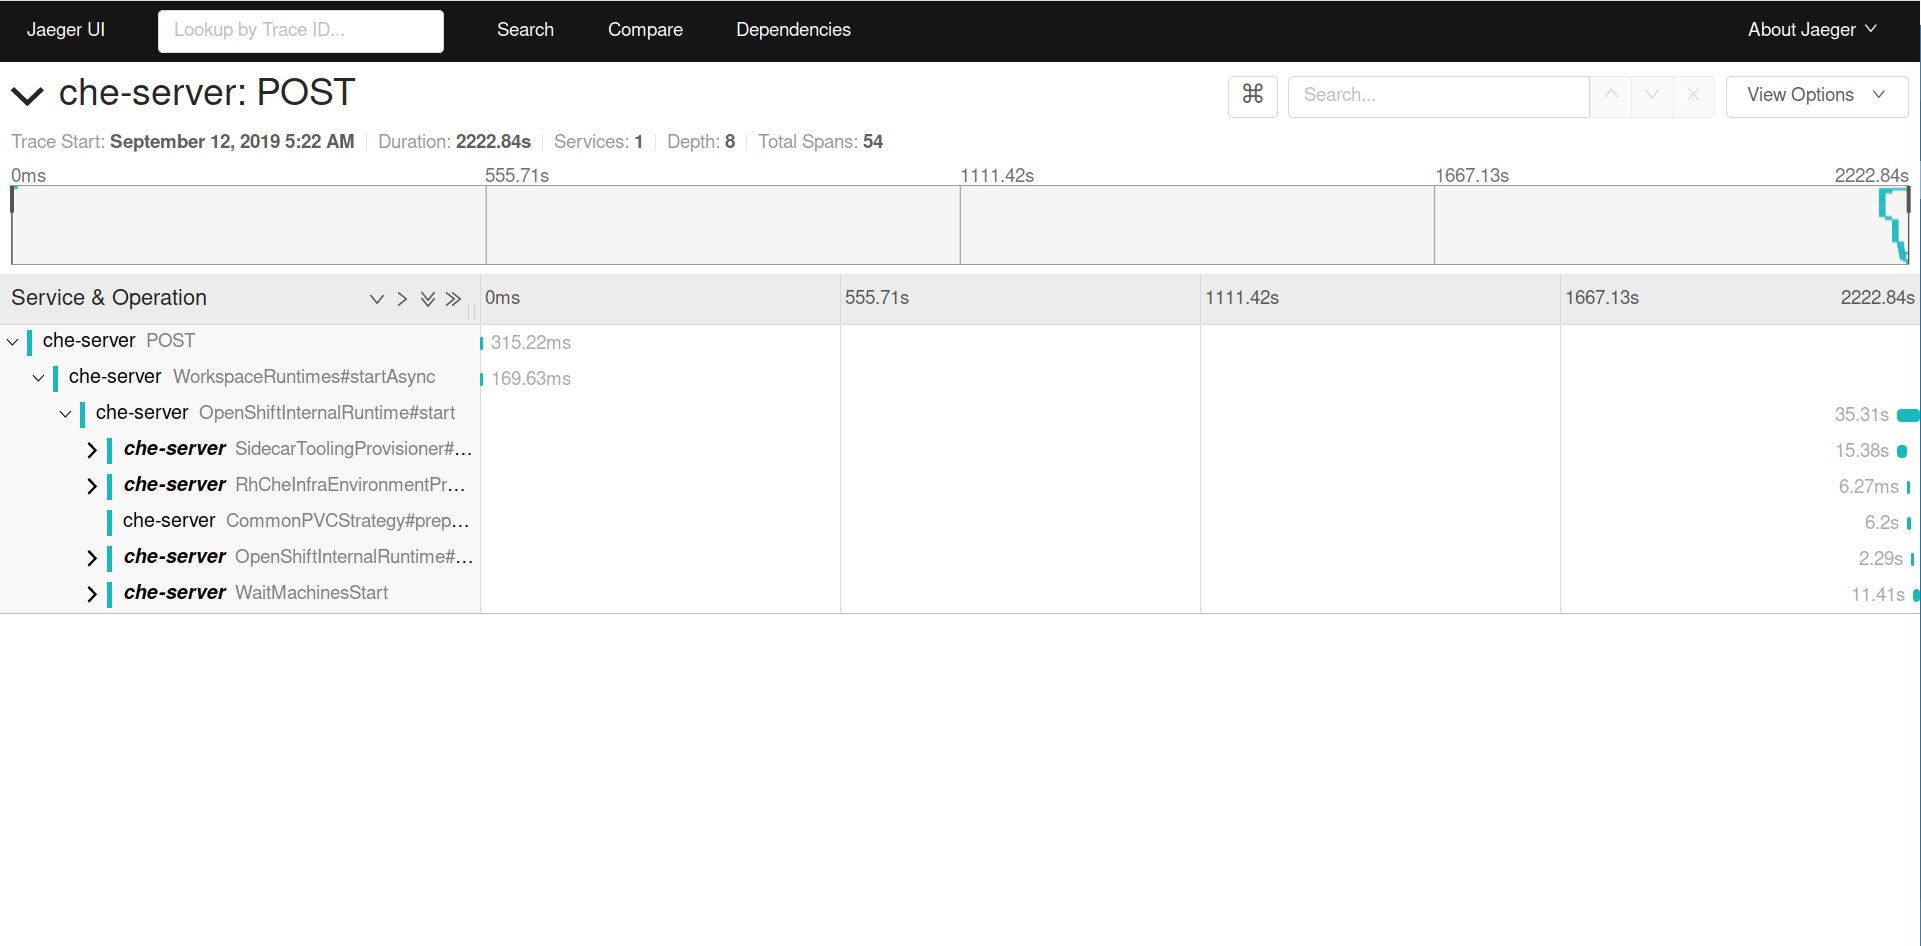
and a sample trace from the peak:
I believe this usually happens around the time a new version of Che is rolled out (but I don't remember the details in previous occurrences of this issue).
I don't see anything relevant in logs that would explain this. Also note that these workspaces are not timing out, suggesting it is a thread scheduling issue.
Che version
- [x] other: 7.1.0
Steps to reproduce
No consistent reproducer
Runtime
- [x] Openshift 3.11 (prod cluster)
 amisevsk
All 19 comments
adding P1 label
 ibuziuk
on 12 Sep 2019
ibuziuk
on 12 Sep 2019
Also, from briefly looking into the code, it looks like the WorkspaceSharedPool is by default initializing with a 2-thread pool, which may be related.
amisevsk
on 12 Sep 2019
@skabashnyuk @sleshchenko any thoughts on that ^
ibuziuk
on 12 Sep 2019
- plugin brokering
- image pooling.
 skabashnyuk
on 12 Sep 2019
skabashnyuk
on 12 Sep 2019
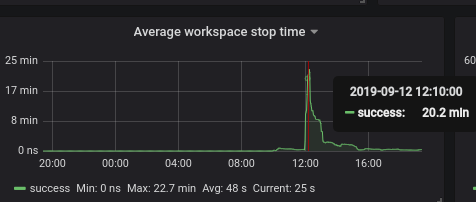
@skabashnyuk what about average workspace stop that took more than 22 minutes - no plugin brokering or image polling involved on this step, it looks like smth. happens with threads on the recovery step just after rollout update.
ibuziuk
on 12 Sep 2019
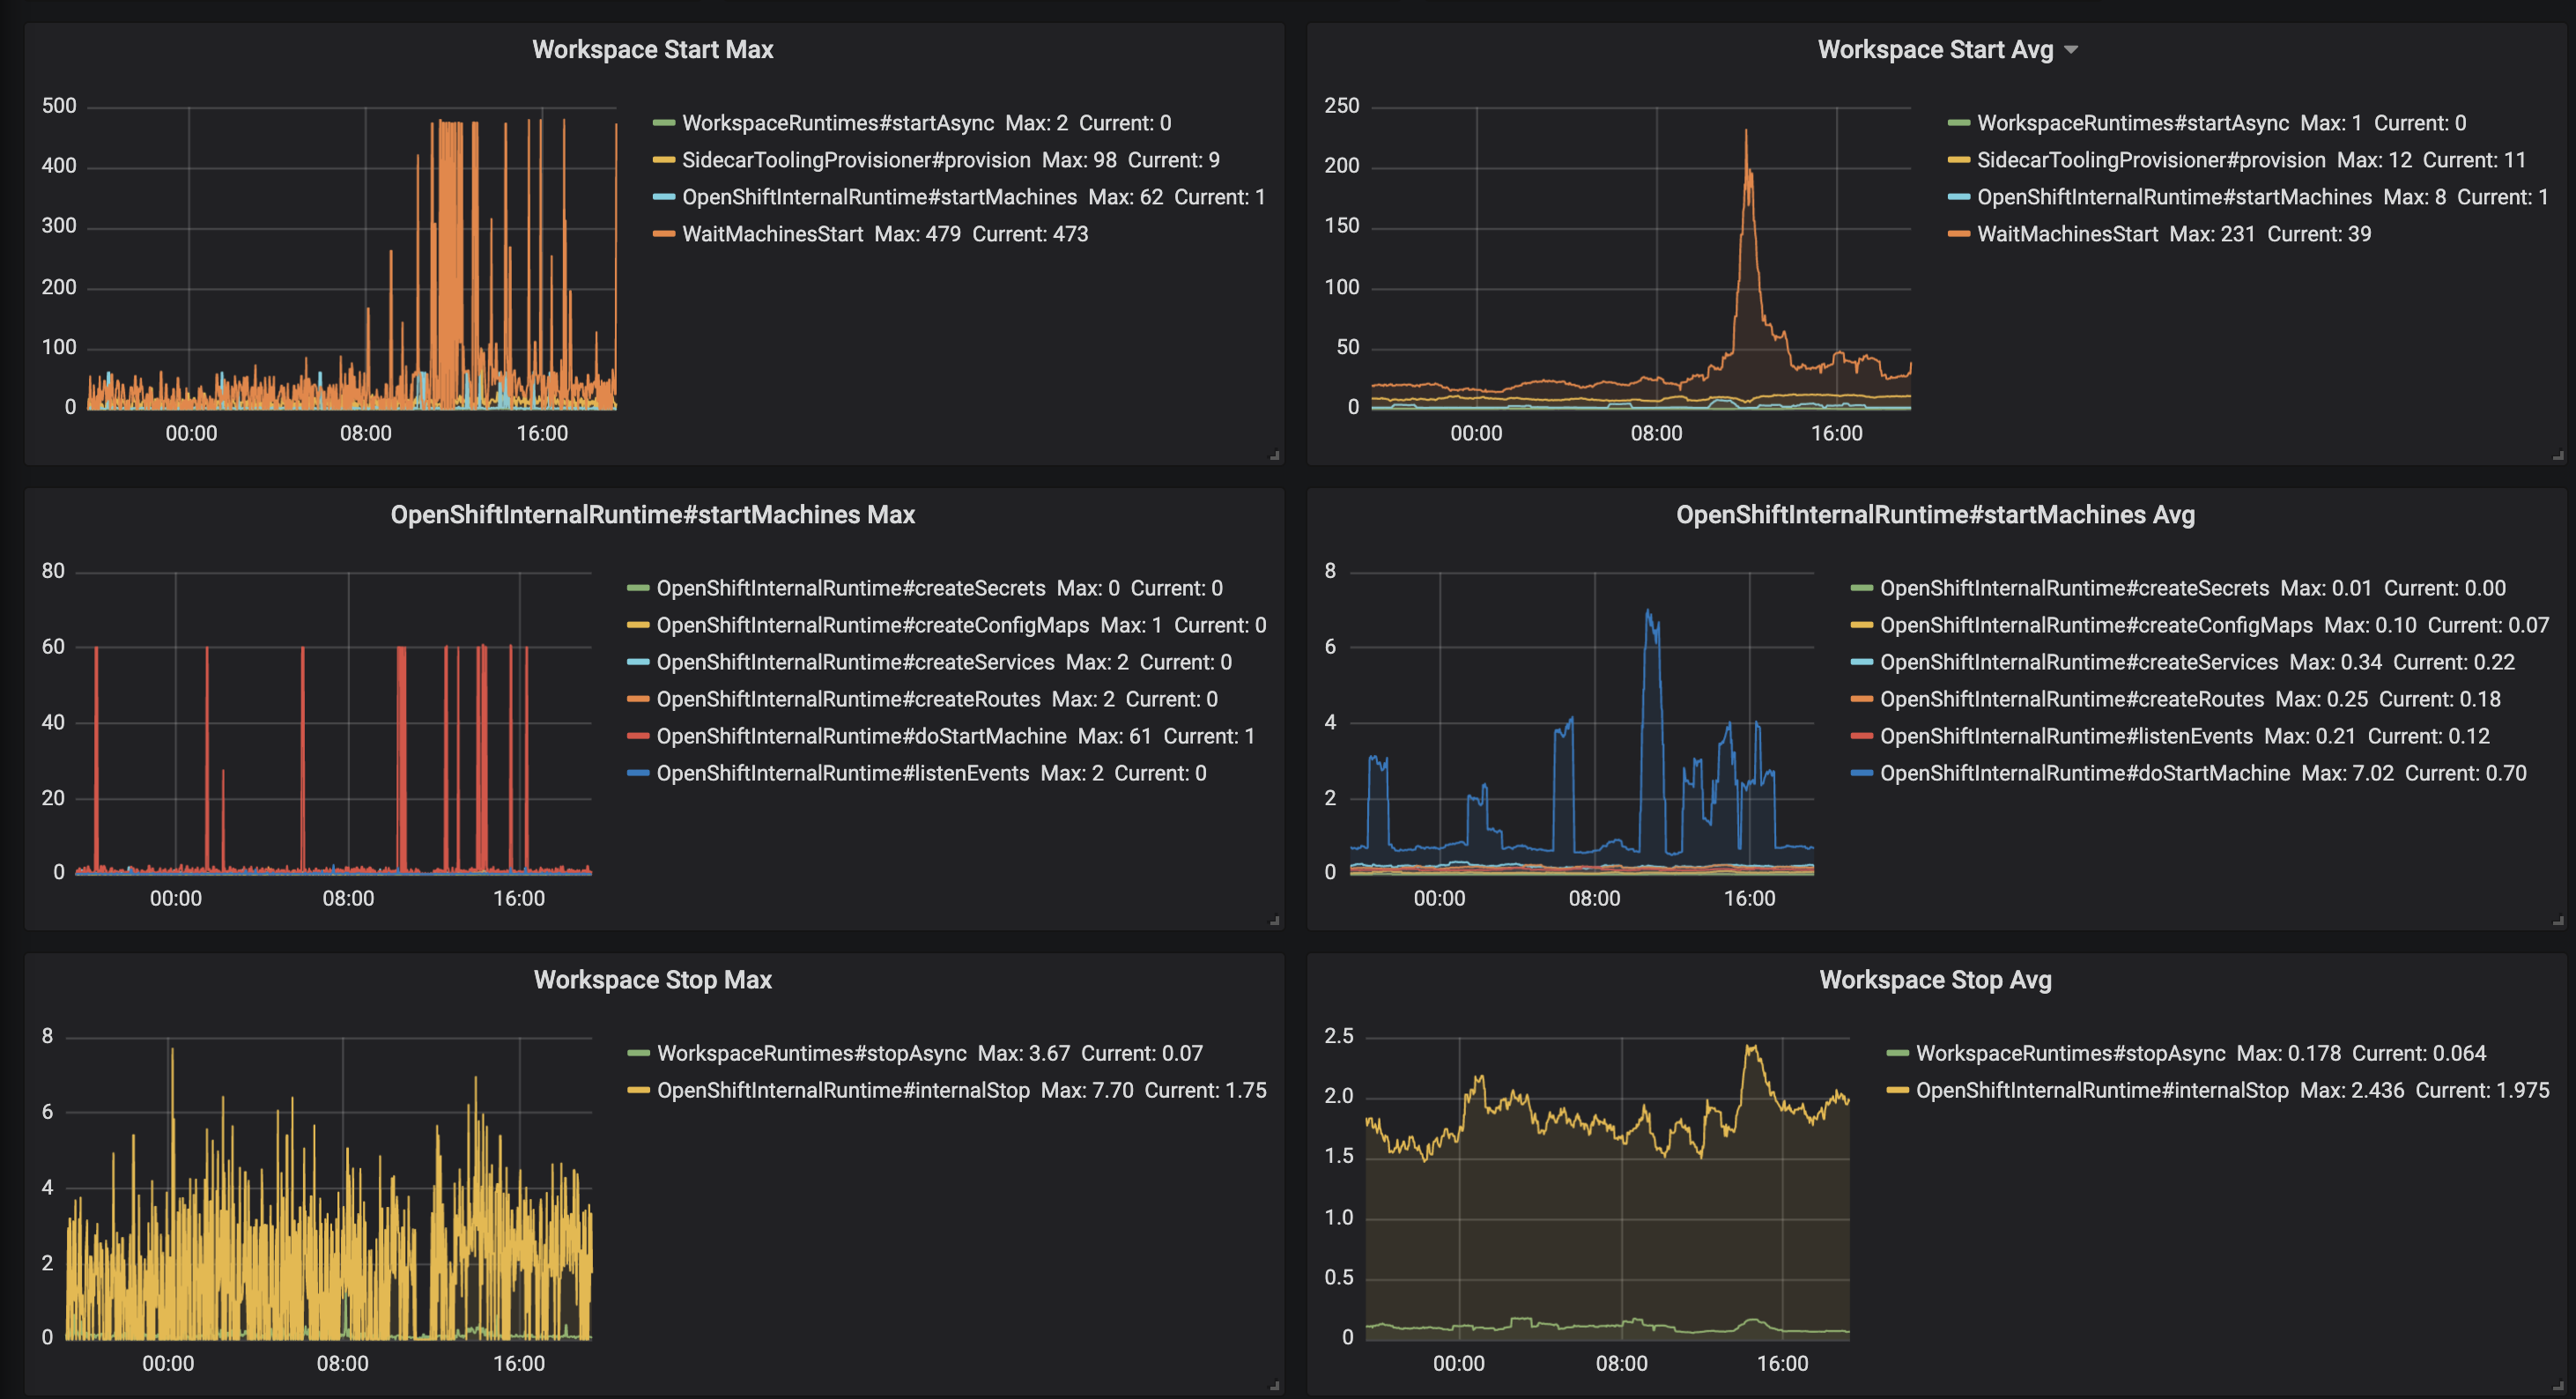
I clearly see issue with start time. But I can't see issue with stop time. According to this data avg stop time is about 2sec, maximim 8sec
skabashnyuk
on 12 Sep 2019
@skabashnyuk stopping took more than 22 minutes:
ibuziuk
on 12 Sep 2019
interesting
skabashnyuk
on 12 Sep 2019
plugin brokering
Plugin brokering is included in the trace; you can see that it doesn't begin until after the 20 minutes are up (SidecarToolingProvisioner)
amisevsk
on 12 Sep 2019
Basically, from what I can tell in the traces,
WorkspaceRuntimes#startAsyncfinishes, calling
return CompletableFuture.runAsync( ThreadLocalPropagateContext.wrap(new StartRuntimeTask(workspace, options, runtime)), sharedPool.getExecutor());- Many minutes later,
InternalRuntime#startgets executed.
Edit: I also did a bit of checking to see if runtimes recovery was related, but it appears to not be, as recovery completed around an hour before we started seeing the slowdown.
amisevsk
on 12 Sep 2019
I believe we need to switch to newCachedThreadPool on production:
Creates a thread pool that creates new threads as needed, but will reuse previously constructed threads when they are available. These pools will typically improve the performance of programs that execute many short-lived asynchronous tasks. Calls to execute will reuse previously constructed threads if available. If no existing thread is available, a new thread will be created and added to the pool. Threads that have not been used for sixty seconds are terminated and removed from the cache. Thus, a pool that remains idle for long enough will not consume any resources. Note that pools with similar properties but different details (for example, timeout parameters) may be created using ThreadPoolExecutor constructors
ibuziuk
on 17 Sep 2019
I believe we need to switch to newCachedThreadPool on production:
:+1: Starts are long lived so we can easily run out of threads.
 metlos
on 17 Sep 2019
ibuziuk
on 23 Sep 2019
metlos
on 17 Sep 2019
ibuziuk
on 23 Sep 2019
I have a few questions following on to #14631:
- What version of Che is codenvy.io running/what's different in the current master?
- How often is codenvy.io restarted? We saw the issue around a restart.
- Is there some implicit assumption in codenvy.io that is violated on OpenShift/Kubernetes? From my testing, it seems that
Runtime.getRuntime().availableProcessors()returns1on an OpenShift cluster. This means that with default values the thread pool gets two threads allocated. - What functionality uses the workspace shared pool? Should this be reexamined? From a quick search through the codebase, I see the workspace shared pool used by
- start/stop async processes
- workspace recovery
- runtime hanging detector (track starting & stopping workspaces)
- service termination
cc @skabashnyuk @sleshchenko from your comments on the PR.
amisevsk
on 24 Sep 2019
What version of Che is codenvy.io running/what's different in the current master?
I believe it is the latest 5.x (pre 6.x)
How often is codenvy.io restarted? We saw the issue around a restart.
very rare. I think we saw issues around massive workspace startup.
Is there some implicit assumption in codenvy.io that is violated on OpenShift/Kubernetes? From my testing, it seems that Runtime.getRuntime().availableProcessors() returns 1 on an OpenShift cluster. This means that with default values the thread pool gets two threads allocated.
May be Runtime.getRuntime().availableProcessors() can return different value when it runs on docker. Or the node that is running che master on codenvy.io just have more cores.
What functionality uses the workspace shared pool? Should this be reexamined?
What do you mean by reexamined?
My understanding that the pool configuration can be a source of the issue and we definitely need to test and prove that. I think https://github.com/eclipse/che/issues/14601 can help here. Also, I think we may add manual mode to KubernetesSharedPool, WorkspaceSharedPool that would be similar to JsonRPC pools configuration that can allow configuring core threads, maximum threads, and queue sizes.
skabashnyuk
on 24 Sep 2019
What functionality uses the workspace shared pool? Should this be reexamined?
What do you mean by reexamined?
What I mean is that, compared to the codenvy.io deployment, it looks like three things have changed and all come together to cause the issue now:
- From briefly testing on docker,
Runtime.getRuntime().availableProcessors()reports the number of processors on the machine, while the same on OpenShift always reports 1 (even if the node is 12 cores). This means the thread pool is initialized with fewer threads overall - On the Che server side, we're using the workspace shared pool for more things than before; for Che 5.9 the pool is used only for startup, stop, and cleanup on failure. In current Che it's used for more things, which puts more pressure on the pool.
- Certain tasks will schedule many threads (e.g. workspace recovery), which can exacerbate the problem.
I agree that more testing is necessary, though.
amisevsk
on 24 Sep 2019
I believe after applying the following fix https://github.com/eclipse/che/pull/14884 (changing pool size) the issue should not be reproducible anymore e.g. stop time dropped from 12 seconds to 2 seconds on average on hosted che. Will wait for some more data and if metrics would not degrade, going to close this issue as done
ibuziuk
on 16 Oct 2019
after rollout update to 7.3.1 there was a sufficient spike from 2 seconds to 40 that lasted for 1h. The situation has been stabilized, but I believe we still need to investigate the increase in the stop time
ibuziuk
on 4 Nov 2019
Closing as done.
Recent regression with stop was also fixed in master - https://github.com/eclipse/che/issues/16200
ibuziuk
on 5 Mar 2020
Related issues
amisevsk
·
3Comments
 LaneGeek
·
3Comments
LaneGeek
·
3Comments
 redeagle84
·
3Comments
redeagle84
·
3Comments
 dmytro-ndp
·
3Comments
dmytro-ndp
·
3Comments
 l0rd
·
3Comments
l0rd
·
3Comments
Most helpful comment
What I mean is that, compared to the codenvy.io deployment, it looks like three things have changed and all come together to cause the issue now:
Runtime.getRuntime().availableProcessors()reports the number of processors on the machine, while the same on OpenShift always reports 1 (even if the node is 12 cores). This means the thread pool is initialized with fewer threads overallI agree that more testing is necessary, though.