Charts: Bar chart: bars are floating
- [x] I've read, understood, and done my best to follow the *CONTRIBUTING guidelines.
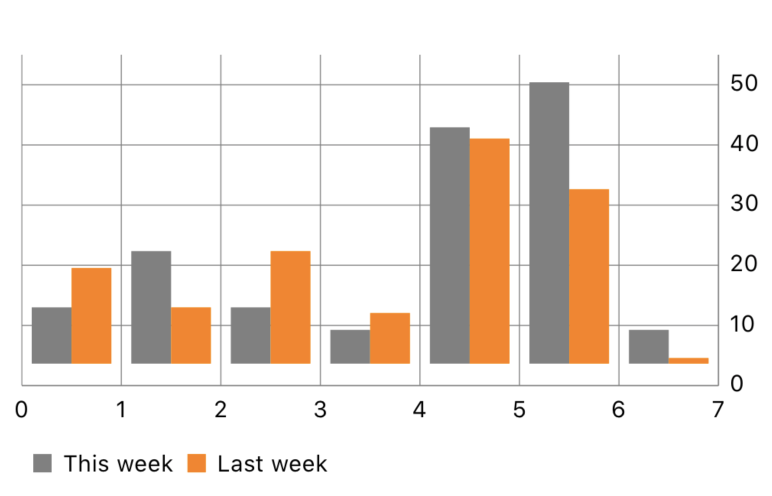
I am creating a grouped bar chart, and for some reason my bars are floating above the 0-point. But it only happens with certain values.
A minimum repro example:
import UIKit
import Charts

class ViewController: UIViewController {
  @IBOutlet private var chartView: BarChartView!

  let groupSpace = 0.2
  let barSpace = 0.0
  let barWidth = 0.4

  override func viewDidLoad() {
    super.viewDidLoad()
    view.backgroundColor = .white
    configure()
  }

  func configure() {
    chartView.xAxis.labelPosition = .bottom
    chartView.xAxis.axisMinimum = 0
    chartView.xAxis.axisMaximum = 7
    chartView.leftAxis.enabled = false
    chartView.rightAxis.axisMinimum = 0

    let currentValues = [
      BarChartDataEntry(x: 0, y: 10),
      BarChartDataEntry(x: 1, y: 20),
      BarChartDataEntry(x: 2, y: 10),
      BarChartDataEntry(x: 3, y: 6),
      BarChartDataEntry(x: 4, y: 42),
      BarChartDataEntry(x: 5, y: 50),
      BarChartDataEntry(x: 6, y: 6),
    ]

    let currentValuesSet = BarChartDataSet(entries: currentValues, label: "This week")
    currentValuesSet.setColor(UIColor.gray)
    currentValuesSet.drawValuesEnabled = false

    let previousValues = [
      BarChartDataEntry(x: 0, y: 17),
      BarChartDataEntry(x: 1, y: 10),
      BarChartDataEntry(x: 2, y: 20),
      BarChartDataEntry(x: 3, y: 9),
      BarChartDataEntry(x: 4, y: 40),
      BarChartDataEntry(x: 5, y: 31),
      BarChartDataEntry(x: 6, y: 1),
    ]

    let previousValuesSet = BarChartDataSet(entries: previousValues, label: "Last week")
    previousValuesSet.setColor(UIColor.orange)
    previousValuesSet.drawValuesEnabled = false

    let data = BarChartData(dataSets: [currentValuesSet, previousValuesSet])
    data.highlightEnabled = false

    data.barWidth = barWidth
    data.groupBars(fromX: 0, groupSpace: groupSpace, barSpace: barSpace)

    chartView.data = data
  }
}
Charts Environment
Charts 3.4.0, via Cocoapods. iOS 13.3, Xcode 11.3.1.
 kevinrenskers
All 4 comments
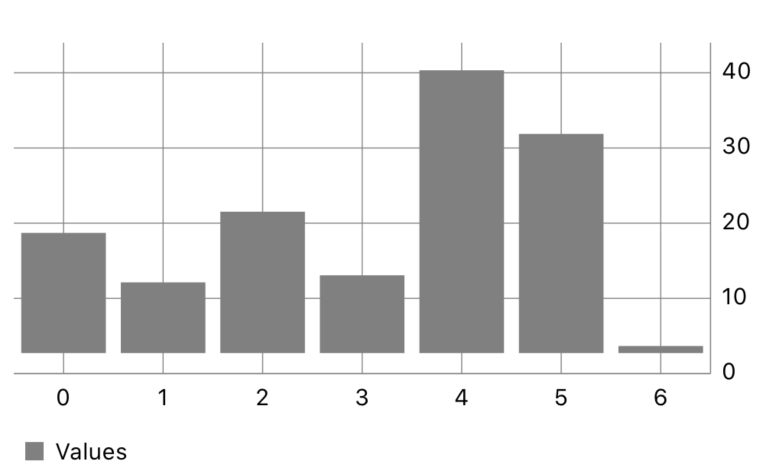
It's not related to grouped bars, here is a smaller example with a single data set:
class ViewController: UIViewController {
  @IBOutlet private var chartView: BarChartView!

  override func viewDidLoad() {
    super.viewDidLoad()
    view.backgroundColor = .white
    configure()
  }

  func configure() {
    chartView.xAxis.labelPosition = .bottom
    chartView.leftAxis.enabled = false
    chartView.rightAxis.axisMinimum = 0
    chartView.dragEnabled = false
    chartView.setScaleEnabled(false)
    chartView.pinchZoomEnabled = false

    let previousValues = [
      BarChartDataEntry(x: 0, y: 17),
      BarChartDataEntry(x: 1, y: 10),
      BarChartDataEntry(x: 2, y: 20),
      BarChartDataEntry(x: 3, y: 11),
      BarChartDataEntry(x: 4, y: 40),
      BarChartDataEntry(x: 5, y: 31),
      BarChartDataEntry(x: 6, y: 1),
    ]

    let previousValuesSet = BarChartDataSet(entries: previousValues, label: "Values")
    previousValuesSet.setColor(UIColor.gray)
    previousValuesSet.drawValuesEnabled = false

    let data = BarChartData(dataSet: previousValuesSet)
    data.highlightEnabled = false

    chartView.data = data
  }
}
Change that last 1 value to 10, and the bars no longer float.
kevinrenskers
on 18 Mar 2020
Found the fix: leftAxis.axisMinimum = 0. Even though the left axis is disabled, this fixes the problem.
kevinrenskers
on 23 Mar 2020
找到了解决方法:
leftAxis.axisMinimum = 0。即使禁用了左轴,也可以解决此问题。
Thank you, I also encountered this problem, which saved me a lot of time.
 chinghoi
on 25 Sep 2020
chinghoi
on 25 Sep 2020
Found the fix:
leftAxis.axisMinimum = 0. Even though the left axis is disabled, this fixes the problem.
If Y values are like 0 to 5 means small then it still shows in float. @kevinrenskers is there any other solution and @danielgindi
could you please help me to short out this problem?
 maulik6994
on 24 Nov 2020
maulik6994
on 24 Nov 2020
Related issues
 anhltse03448
·
3Comments
anhltse03448
·
3Comments
 brytnvmg
·
4Comments
brytnvmg
·
4Comments
 kwstasna
·
3Comments
kwstasna
·
3Comments
 guoyutaog
·
3Comments
guoyutaog
·
3Comments
 valeIT
·
3Comments
valeIT
·
3Comments
Most helpful comment
Found the fix:
leftAxis.axisMinimum = 0. Even though the left axis is disabled, this fixes the problem.