Charts: [stable/prometheus-operator] deployed grafana is missing grafana-piechart-panel plugin
Describe the bug
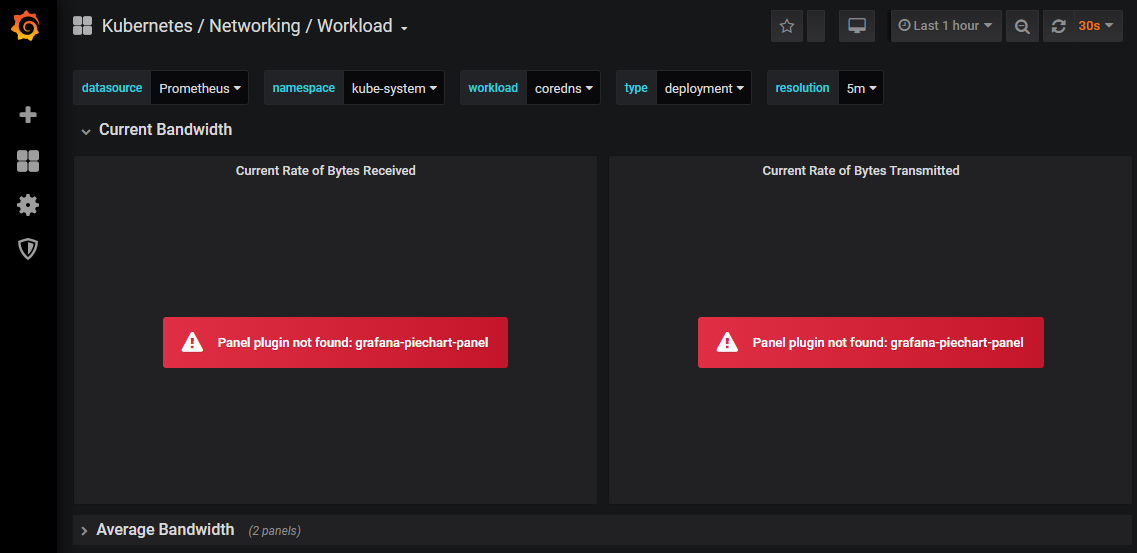
The deployed Grafana is missing the plugin grafana-piechart-panel plugin which is used in Networking related dashboards.
Version of Helm and Kubernetes:
$ helm version
version.BuildInfo{Version:"v3.0.2", GitCommit:"19e47ee3283ae98139d98460de796c1be1e3975f", GitTreeState:"clean", GoVersion:"go1.13.5"}
Kubernetes: 1.16.3-00
Which chart:
[stable/prometheus-operator]
What happened:
Grafana Plugin is missing.
What you expected to happen:
Plugin to be included for all delivered Grafana dashboards.
How to reproduce it (as minimally and precisely as possible):
- Deploy the chart (
helm install --name my-release stable/prometheus-operator) - Use a web browser to go to the freshly deployed Grafana instance
- Navigate to the, e.g., Kubernetes / Networking / Workload dashboard
 torlenor
All 7 comments
Hi all!
We faced this issue too
Does somebody know/have some work around for this issue?
 s2504s
on 8 Jan 2020
s2504s
on 8 Jan 2020
Hi. I have the same issue.
Kubernetes: 1.16.3
Helm version: 3.0.0
 SergeSpinoza
on 14 Jan 2020
SergeSpinoza
on 14 Jan 2020
@s2504s @SergeSpinoza You need to install the plugin. To install the plugin, pass the plugins you want installed as a comma separated string in the values.yaml file.
plugins: "grafana-piechart-panel"
 pnduati
on 21 Jan 2020
pnduati
on 21 Jan 2020
@pnduati But the is no variable plugins - https://github.com/helm/charts/blob/master/stable/prometheus-operator/values.yaml~~
Right, all values for grafana - https://github.com/helm/charts/blob/master/stable/grafana/values.yaml
grafana:
plugins: "grafana-piechart-panel"
It works.
SergeSpinoza
on 21 Jan 2020
@SergeSpinoza Yea, you are right. That is a list
I've set up grafana as part of prometheus-operator and this parameter in my values file looks like :
grafana:
  enabled: true
  plugins:
    - grafana-piechart-panel
.....
This issue has been automatically marked as stale because it has not had recent activity. It will be closed if no further activity occurs. Any further update will cause the issue/pull request to no longer be considered stale. Thank you for your contributions.
![stale[bot] picture](https://avatars.githubusercontent.com/in/1724?v=4&s=40) stale[bot]
on 20 Feb 2020
stale[bot]
on 20 Feb 2020
This issue is being automatically closed due to inactivity.
stale[bot]
on 5 Mar 2020
Related issues
 musabmasood
·
3Comments
musabmasood
·
3Comments
 donkeyx
·
3Comments
donkeyx
·
3Comments
 michas2
·
3Comments
michas2
·
3Comments
 jungopro
·
3Comments
jungopro
·
3Comments
 rajkumar49
·
3Comments
rajkumar49
·
3Comments
Most helpful comment
@SergeSpinoza Yea, you are right. That is a list
I've set up grafana as part of prometheus-operator and this parameter in my values file looks like :