Charts: [stable/prometheus-operator] No CPU data
Describe the bug
No CPU data is displayed on Grafana dashboard's for the latest version of the chart _stable/prometheus-operator_
Version of Helm and Kubernetes:
$ kubectl version
Client Version: version.Info{Major:"1", Minor:"15", GitVersion:"v1.15.5",
Server Version: version.Info{Major:"1", Minor:"15", GitVersion:"v1.15.5",
$ helm version
Client: &version.Version{SemVer:"v2.13.1",
Server: &version.Version{SemVer:"v2.16.1",
Which chart:
_stable/prometheus-operator_, latest version (8.3.3)
What happened:
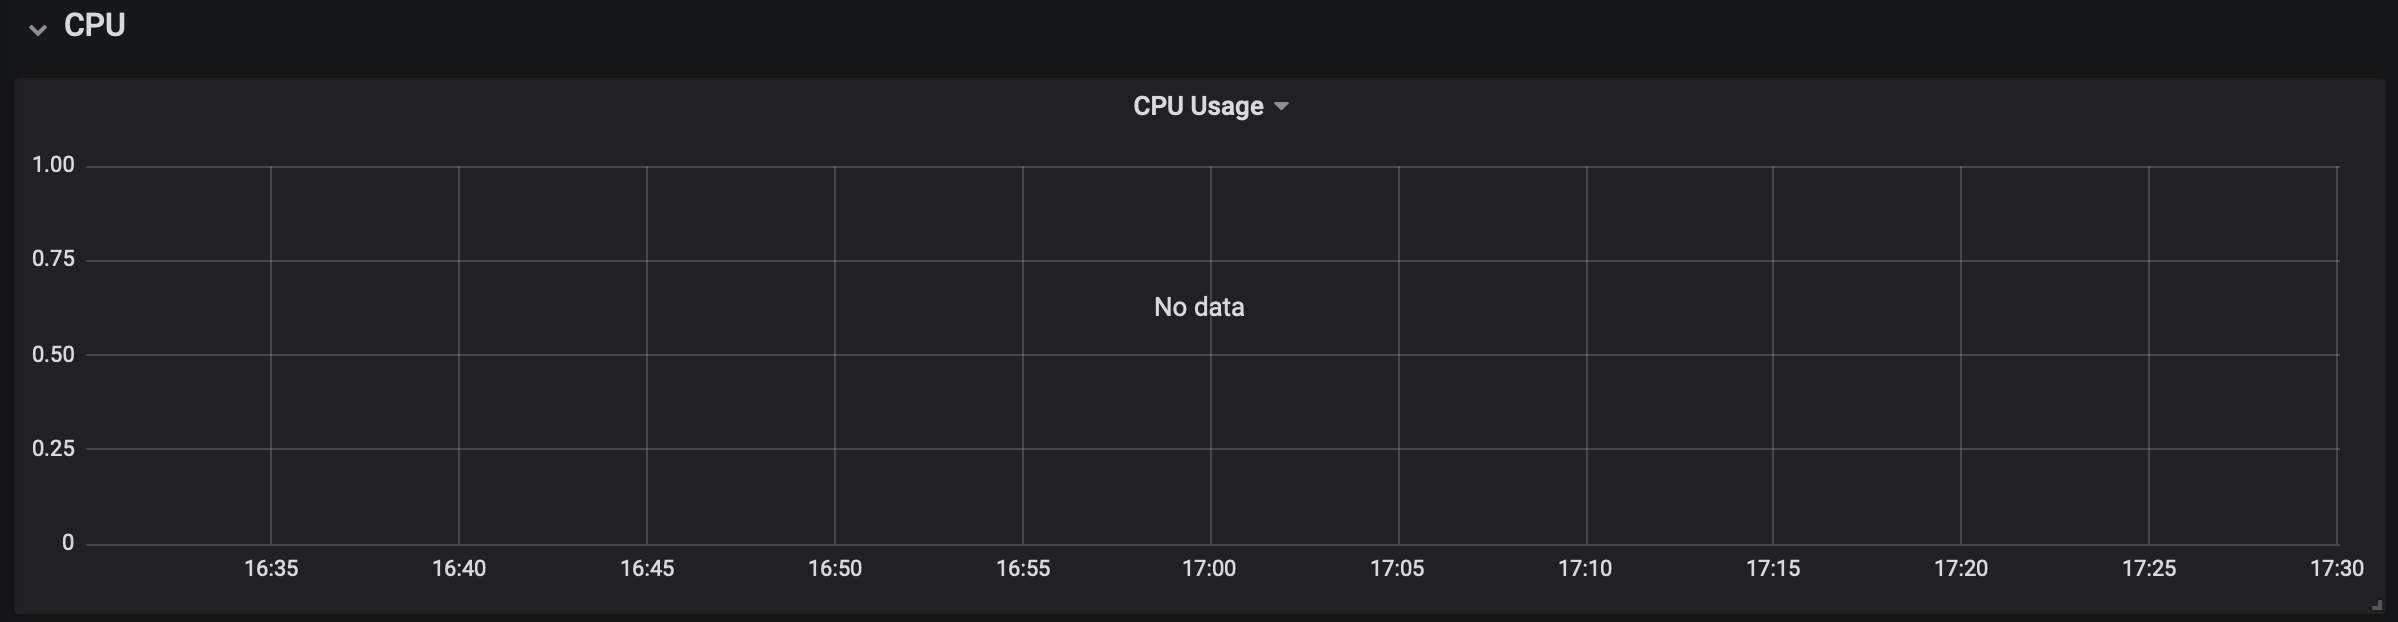
No data for CPU Usage, in the "CPU usage" graph, In any dashboards, installed by default with the "stable/prometheus-operator" chart
What you expected to happen:
CPU Usage of the cluster, plotted in graph
How to reproduce it (as minimally and precisely as possible):
Install the helm chart prometheus-operator in namespace monitoring
define an ingress for grafana
Go to the dashboard "Kubernetes/Compute Resources/Cluster"
Anything else we need to know:
This issue seems to be the same as #18377 ,
 pbradly
All 35 comments
I am facing the same issue.
The query needs to be updated and so is the filter.
"expr": "instance:node_cpu_utilisation:rate1m{job=\"node-exporter\", kubernetes_node=\"$instance\"}",
https://github.com/helm/charts/blob/d6b8bd59f6d1384a26e14e64de7a6b9aea8593ea/stable/prometheus-operator/templates/grafana/dashboards-1.14/node-rsrc-use.yaml#L938
"query": "label_values(instance:node_cpu_utilisation:rate1m{job=\"node-exporter\"}, kubernetes_node)",
 arijitdey
on 17 Dec 2019
arijitdey
on 17 Dec 2019
I'm seeing the same behaviour in EKS version 1.14.x
I've upgraded to the newest version and now I don't see any data. I had to downgrade to version 5.x to make it work again.
I'm sorry for the stupid question but, are these charts compatible with 1.14 or only 1.15+?
 italolelis
on 18 Dec 2019
italolelis
on 18 Dec 2019
@vsliouniaev, @kpucynski I know you guys previously helped out with #18377 , would anyone be able to confirm the root cause and if there are any potential fixes?
pbradly
on 9 Jan 2020
The basic problem with grafana dashboards is that they are generated automatically and source data are in different repos. It seems that there is not enough version checks and those templates should have more granular version assignment.
Unfortunately no one bothers because older versions of K8S are not actively supported.
And icing on the cake: this charts repository will be deprecated soon.
 kpucynski
on 10 Jan 2020
kpucynski
on 10 Jan 2020
This is still an issue with the latest chart i.e 8.5.10, no CPU metrics under Kubernetes/Compute Resources/Cluster.
Versions:
- Kubectl: Server Version: version.Info{ Major:"1", Minor:"15", GitVersion:"v1.15.3
- helm: client - 2.12.2, server - 2.14.2
@italolelis can you provide more details around the downgrade which worked for you?
 svadnala
on 16 Jan 2020
svadnala
on 16 Jan 2020
Experiencing the same issue for 1.14. And also for memory usage.
 andrewnazarov
on 17 Jan 2020
andrewnazarov
on 17 Jan 2020
This is still an issue with the latest chart i.e 8.5.10, no CPU metrics under Kubernetes/Compute Resources/Cluster.
Versions:
- Kubectl: Server Version: version.Info{ Major:"1", Minor:"15", GitVersion:"v1.15.3
- helm: client - 2.12.2, server - 2.14.2
@italolelis can you provide more details around the downgrade which worked for you?
downgrading to chart 8.1.2 as per https://github.com/scality/metalk8s/pull/2174 seems to fix the issue.
Following has been verified to show CPU metrics:
- Kubernetes/Compute Resources/Cluster
- Kubernetes/Compute Resources/Namespace (Pods)
- Kubernetes/Compute Resources/Namespace (Workloads)
- Kubernetes/Compute Resources/Node (Pods)
- Kubernetes/Compute Resources/Pod
- Kubernetes/Compute Resources/Workload
svadnala
on 20 Jan 2020
Can we get some traction on this issue? this issue is yet to be assigned and it seems to effect multiple people. ideally would like to use the latest stable version.
svadnala
on 21 Jan 2020
We really like to continuously upgrade our cluster to take advantage of latest prometheus-operator releases features and fixes. However, this issue is blocking upgrade from prometheus-operator-8.1.2. We really want latest version of grafana and don't want to fork the chart.
 iangkent
on 29 Jan 2020
iangkent
on 29 Jan 2020
So I have spent the past few days digging into this and I believe I have discovered the root cause (at least for us).
For our deployment, we have disabled the default rules that come with the prometheus-operator chart and instead define our own alerts. This however means that the rules file k8s.rules.yaml does not get deployed;
This file defines all the the various metrics such as node_namespace_pod_container:container_cpu_usage_seconds_total:sum_rate;
If these are never deployed, then the default grafana dashboards are never able to pick up the metrics and as such, the graphs appear empty.
Long term I believe these rules should be deployed if grafana.defaultDashboardsEnabled is enabled as true and not if defaultRules.rules.k8s and defaultRules.create are defined as true. We don't want to use the default prometheus alerts that get deployed if defaultRules.create is defined as true but we do want to use the default grafana dashboards, which require the k8s.rules.yaml to be deployed.
pbradly
on 30 Jan 2020
Same issue on AKS
 Keramblock
on 31 Jan 2020
Keramblock
on 31 Jan 2020
The issue for me seemed to be an update to the rules that added the metrics_path="/metrics/cadvisor" filter, when this label was missing from the metrics - which was caused by using an old values file that was overwriting default relabelings.
 peterholak
on 31 Jan 2020
peterholak
on 31 Jan 2020
@kpucynski , what do you mean by older versions of K8S?, I'm on 1.15.5 and I still see the issue.
admin@ip-xx-x-x-xx:~$ helm list -n monitoring
NAME                NAMESPACE   REVISION    UPDATED                                 STATUS      CHART                       APP VERSION
prometheus-operator monitoring  2           2020-01-31 17:44:27.405005672 +0000 UTC deployed    prometheus-operator-8.3.3   0.34.0

admin@ip-xx-x-x-xx:~$ kubectl version
Client Version: version.Info{Major:"1", Minor:"15", GitVersion:"v1.15.5", GitCommit:"20c265fef0741dd71a66480e35bd69f18351daea", GitTreeState:"clean", BuildDate:"2019-10-15T19:16:51Z", GoVersion:"go1.12.10", Compiler:"gc", Platform:"linux/amd64"}
Server Version: version.Info{Major:"1", Minor:"15", GitVersion:"v1.15.5", GitCommit:"20c265fef0741dd71a66480e35bd69f18351daea", GitTreeState:"clean", BuildDate:"2019-10-15T19:07:57Z", GoVersion:"go1.12.10", Compiler:"gc", Platform:"linux/amd64"}
Is there any way to fix this? Or should I just fork the repo and add the changes from my own fork?
I've already reported this here https://github.com/helm/charts/issues/18377#issuecomment-565114966
 alterx
on 31 Jan 2020
alterx
on 31 Jan 2020
Do it =)
Keramblock
on 3 Feb 2020
@alterx AFAIR it was working with some specific K8S version. I'm not much into this issue now because I didn't touch this chart for some time...
If you have fix for it please create PR with it.
kpucynski
on 3 Feb 2020
I'm seeing this issue on k8s 1.15.3
With chart version 8.2.0 is working fine but I've tried with 8.5.4 and 8.7.0 both don't show metrics especially for CPU (pods/nodes etc.) in Grafana.
Any idea what has change since 8.2.0?
Is this related to k8s version?
Thanks!
 metost
on 7 Feb 2020
metost
on 7 Feb 2020
This issue has been automatically marked as stale because it has not had recent activity. It will be closed if no further activity occurs. Any further update will cause the issue/pull request to no longer be considered stale. Thank you for your contributions.
![stale[bot] picture](https://avatars.githubusercontent.com/in/1724?v=4&s=40) stale[bot]
on 8 Mar 2020
stale[bot]
on 8 Mar 2020
Anything new? Thanks!
metost
on 8 Mar 2020
This issue has been automatically marked as stale because it has not had recent activity. It will be closed if no further activity occurs. Any further update will cause the issue/pull request to no longer be considered stale. Thank you for your contributions.
stale[bot]
on 7 Apr 2020
Is there a fix for installing the chart on a 1.15 cluster and getting cpu/memory usage?
 rexroof
on 13 Apr 2020
rexroof
on 13 Apr 2020
bump
 Morriz
on 4 May 2020
Morriz
on 4 May 2020
I've been having the same issue (k8s 1.15.10, chart 8.13.7 - running on AKS)
Although I think my issue might be related to RBAC permissions. I've tried running the same cluster without RBAC and no issues. Turn RBAC on (with AD integration) and none of those node/container metrics work although everything else is fine.
I wonder whether anyone else with issues are using RBAC? I haven't figured out a workaround yet, but something to investigate.
After some investigation, it appears my underlying issue is AKS related
 alhails
on 20 May 2020
alhails
on 20 May 2020
This issue has been automatically marked as stale because it has not had recent activity. It will be closed if no further activity occurs. Any further update will cause the issue/pull request to no longer be considered stale. Thank you for your contributions.
stale[bot]
on 20 Jun 2020
bump
metost
on 20 Jun 2020
this issue still prevalent... using eks v1.14.9 with prometheus-operator 8.15.5;
has anyone found a fix for this/workaround? it was working perfectly fine in 8.2.3
 jyipks
on 24 Jun 2020
jyipks
on 24 Jun 2020
Hey I am using the 8.15.6 chart and k8s version v1.15.2 and I cant see CPU data on Grafana .. Also cant see kubelet data too in the kubelet dashboard too.. All the service monitors are in green state (including the kubelet). Any fix for this?
 dileekafernando
on 30 Jun 2020
dileekafernando
on 30 Jun 2020
This seems like a dupe of #18377
Morriz
on 10 Jul 2020
Ok, same problem on Google GKE 1.15 cluster. 8.15.14 does not pull metrics.
Sorry, just looked at resource with too large requests and usage didn't show ;p
Morriz
on 16 Jul 2020
This issue has been automatically marked as stale because it has not had recent activity. It will be closed if no further activity occurs. Any further update will cause the issue/pull request to no longer be considered stale. Thank you for your contributions.
stale[bot]
on 16 Aug 2020
Bump
metost
on 16 Aug 2020
This is fixed for me with the latest version of the helm chart.
rexroof
on 17 Aug 2020
This is fixed for me with the latest version of the helm chart.
What is the version of the chart that you have tested and also what is your k8s version?
metost
on 17 Aug 2020
FYI: Azure recently started supporting https again for kubelet probes.
Morriz
on 17 Aug 2020
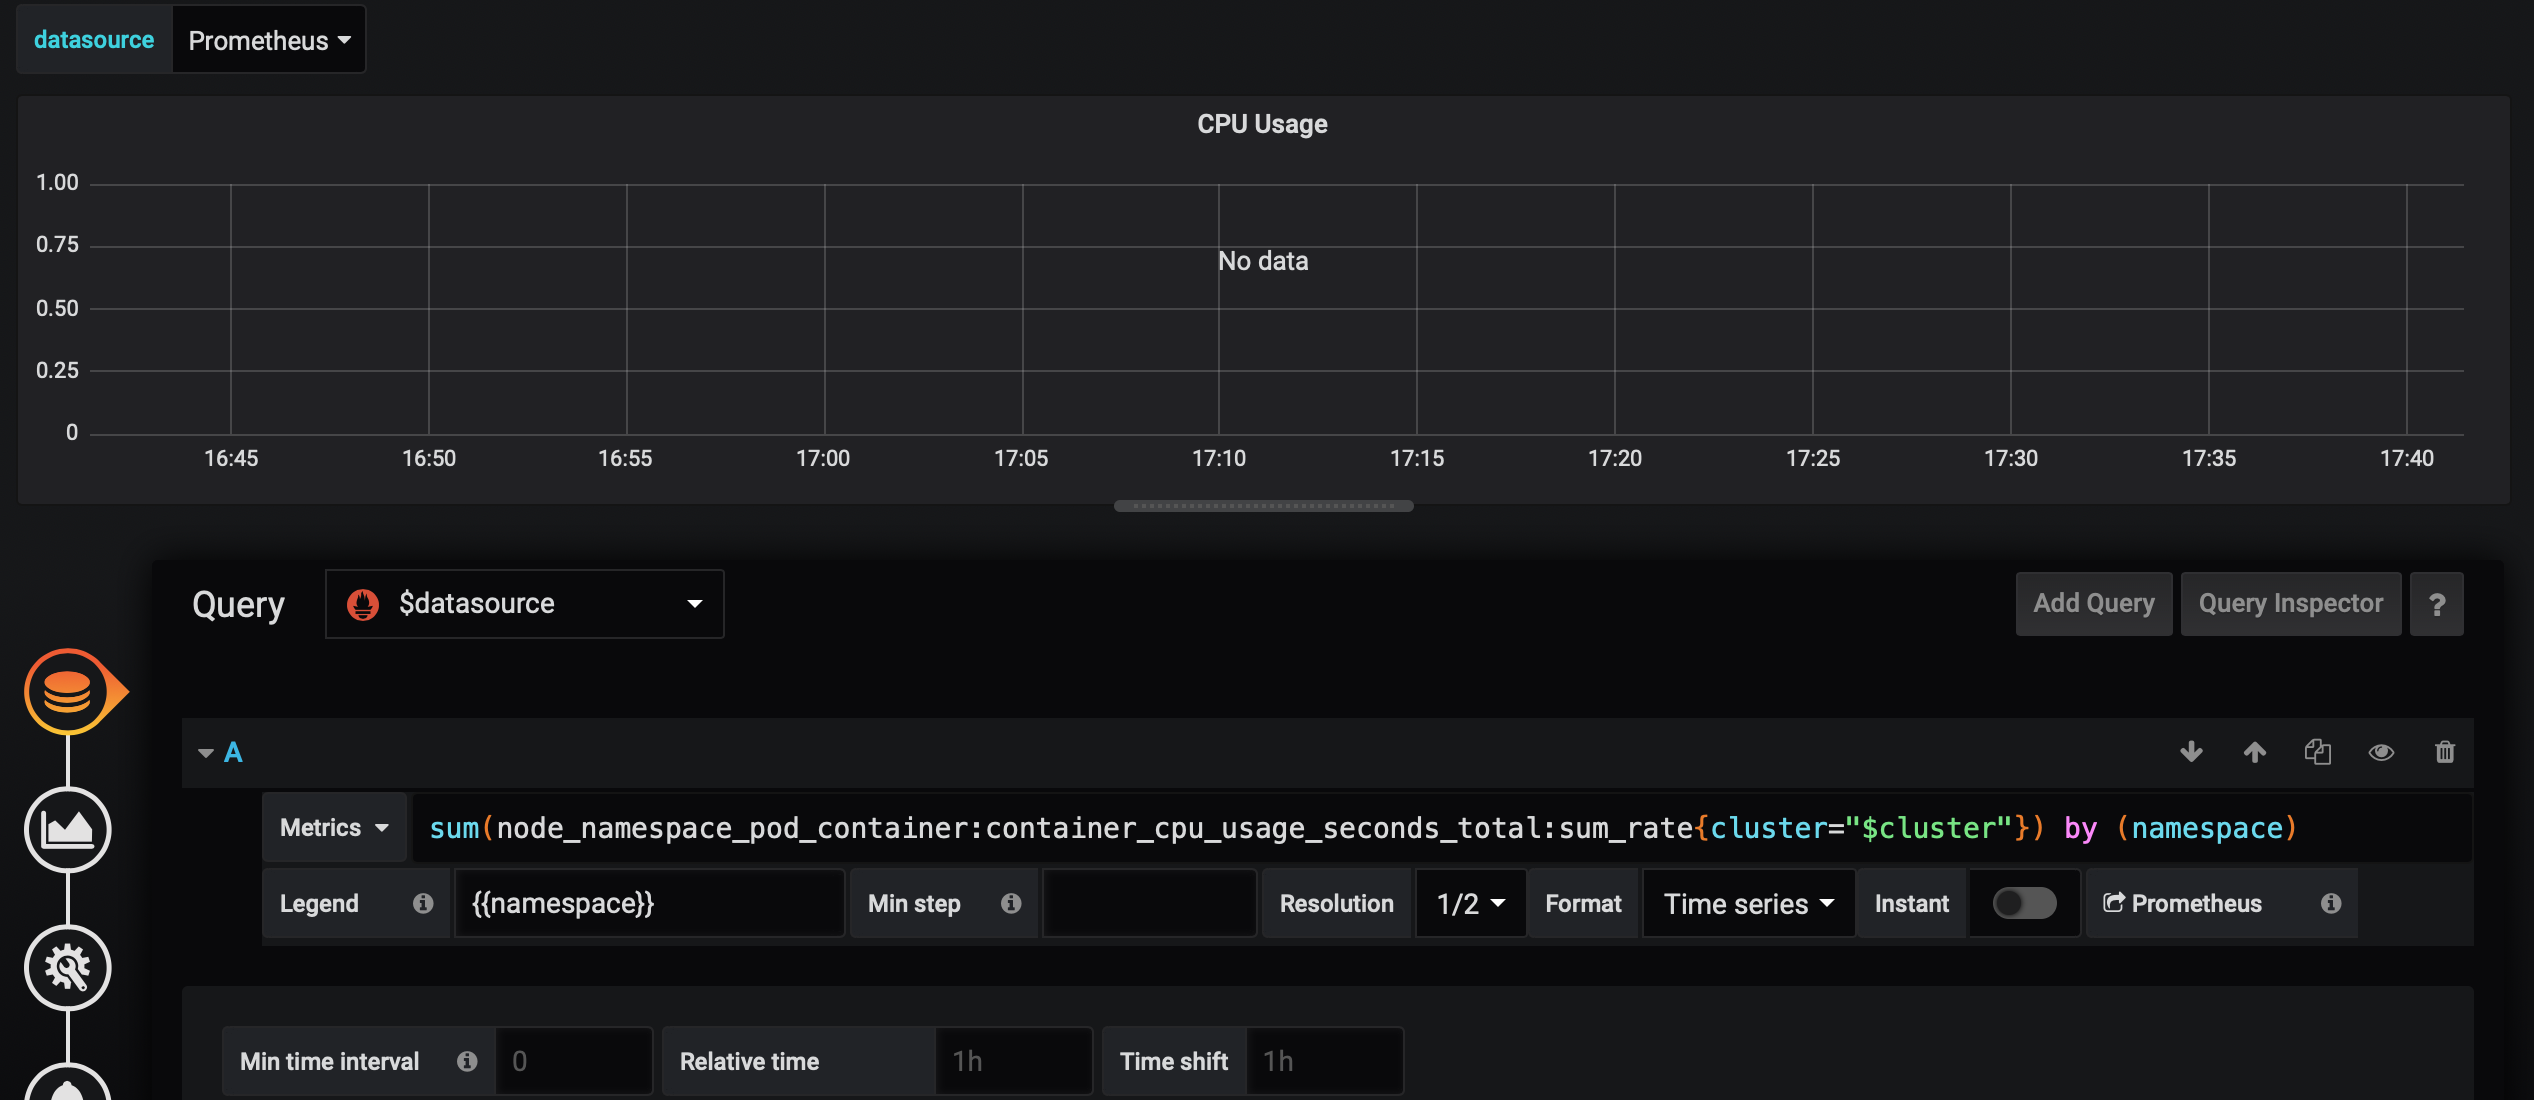
chart 9.3.1 prometheus-operator, k8s 1.17.9 it happens also... do you know what could be solution?
sum(node_namespace_pod_container:container_cpu_usage_seconds_total:sum_rate{cluster="$cluster"}) by (namespace)
 nkol
on 19 Aug 2020
nkol
on 19 Aug 2020
🚧 This chart is now deprecated.
Further development has moved to prometheus-community/helm-charts. The chart has been renamed kube-prometheus-stack to more clearly reflect that it installs the kube-prometheus project stack, within which Prometheus Operator is only one component.
If applicable, please re-open this issue there. Thanks!
 scottrigby
on 9 Sep 2020
scottrigby
on 9 Sep 2020
Related issues
 gajus
·
3Comments
gajus
·
3Comments
 onyxet
·
3Comments
onyxet
·
3Comments
 mluedke
·
3Comments
mluedke
·
3Comments
 tyg03485
·
3Comments
tyg03485
·
3Comments
 rajkumar49
·
3Comments
rajkumar49
·
3Comments
Most helpful comment
I'm seeing the same behaviour in EKS version 1.14.x
I've upgraded to the newest version and now I don't see any data. I had to downgrade to version 5.x to make it work again.
I'm sorry for the stupid question but, are these charts compatible with 1.14 or only 1.15+?