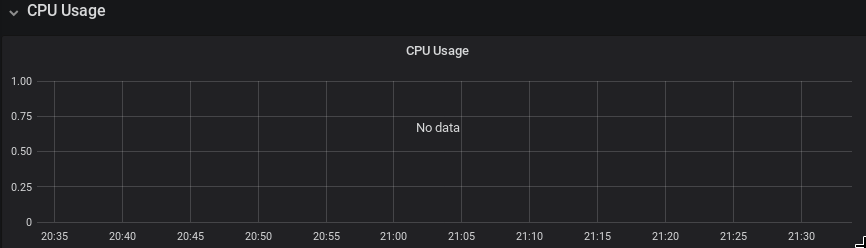
Charts: prometheus-operator - "Cluster CPU usage" - No data
Describe the bug
No data for CPU Usage, in the "CPU usage" graph, In the "Kubernetes/Compute Resources/Cluster" dashboard, installed by default with the "stable/prometheus-operator" chart
This is what my dashboard looks like ;

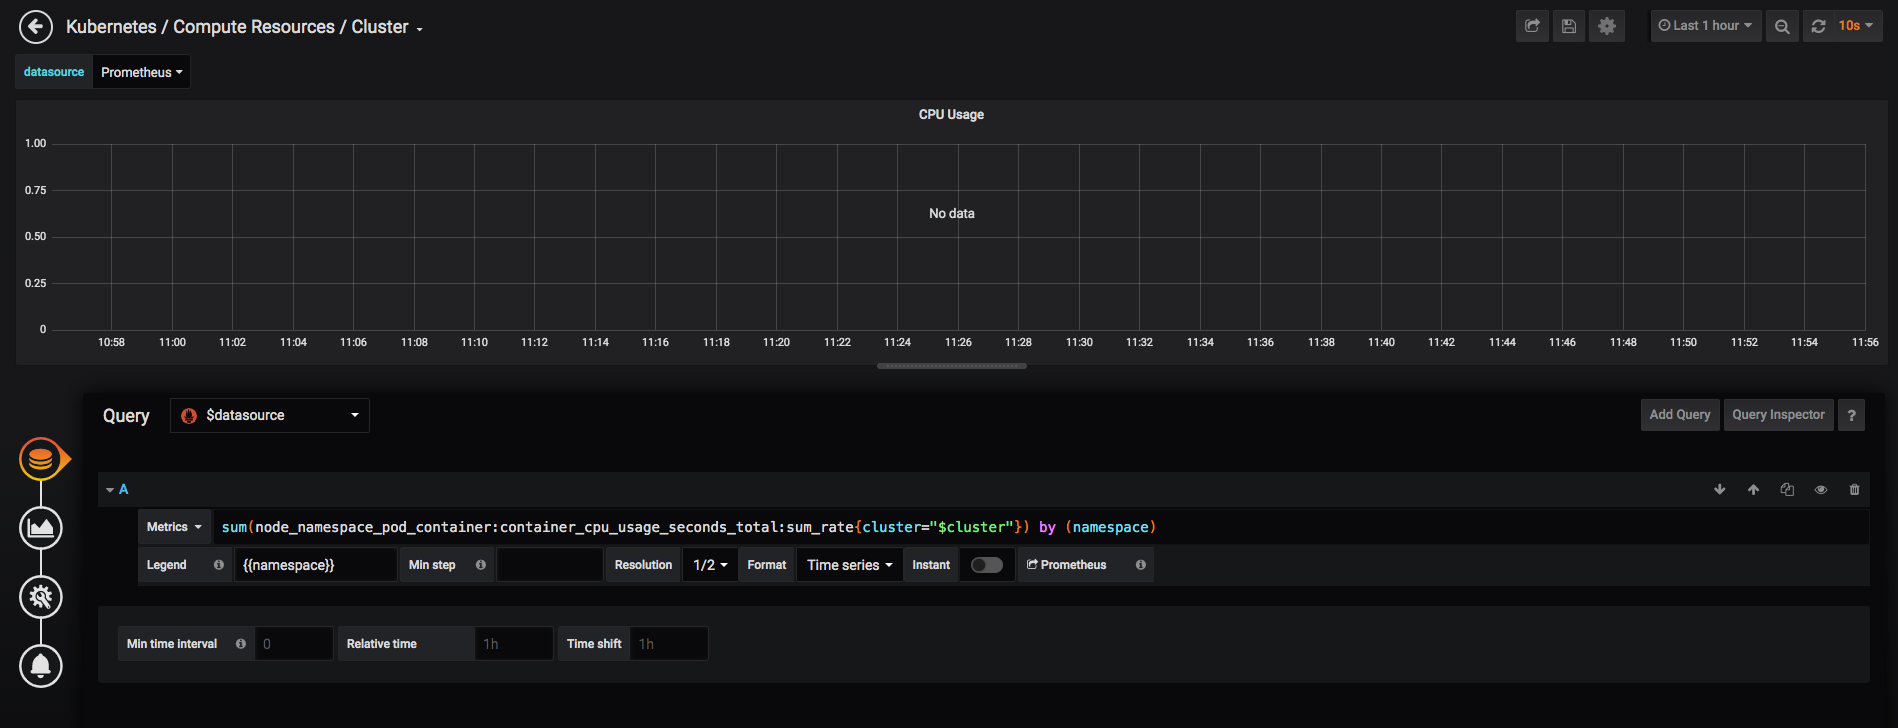
The edit screen shows its related to the this PR https://github.com/helm/charts/pull/18109

Version of Helm and Kubernetes:
Client: &version.Version{SemVer:"v2.14.3", GitCommit:"0e7f3b6637f7af8fcfddb3d2941fcc7cbebb0085", GitTreeState:"clean"}
Server: &version.Version{SemVer:"v2.14.3", GitCommit:"0e7f3b6637f7af8fcfddb3d2941fcc7cbebb0085", GitTreeState:"clean"}
Which chart:
stable/prometheus-operator
What happened:
No data for CPU Usage, in the "CPU usage" graph, In the "Kubernetes/Compute Resources/Cluster" dashboard, installed by default with the "stable/prometheus-operator" chart
What you expected to happen:
CPU Usage of the cluster, plotted in graph
How to reproduce it (as minimally and precisely as possible):
- Create a cluster with kubeadm (single node or multinode) using this config ;
apiVersion: kubeadm.k8s.io/v1beta2
kind: ClusterConfiguration
kubernetesVersion: v1.15.4
clusterName: laptop
networking:
  podSubnet: 10.244.0.0/16
controllerManager:
  extraArgs:
    bind-address: 0.0.0.0
scheduler:
  extraArgs:
    address: 0.0.0.0
---
address: 0.0.0.0
apiVersion: kubelet.config.k8s.io/v1beta1
kind: KubeletConfiguration
address: 0.0.0.0
authentication:
  anonymous:
    enabled: false
  webhook:
    cacheTTL: 2m0s
    enabled: true
authorization:
  mode: Webhook
- Initialize helm version 2.14.3 as per docs
- Install the helm chart prometheus-operator in namespace monitoring
- Create a ingress or service to expose Grafana
- Go to the dashboard "Kubernetes/Compute Resources/Cluster" in grafana
- You can see the graph has no data for CPU usage
Anything else we need to know:
I see a recent commit by @kpucynski
58f270cc5c48eaf39b9e9e0bb6d36d589761be01 that seems related .
The metric "node_namespace_pod_container" is not visible in the intelligent dropdown that appears while building a query manually.
https://files.slack.com/files-pri/T09NY5SBT-FPGV6H3BM/image.png
 longwuyuan
All 51 comments
@kpucynski Please advise if you have any thoughts or suggestions. Thank you
longwuyuan
on 26 Oct 2019
@kpucynski @gianrubio @vsliouniaev Please help. This PR https://github.com/helm/charts/pull/18109 seems to have broken CPU metrics. I don't see "node_namespace_pod_container" in the dropdown while building a query. All I am requesting for is a confirmation that something is broken on my cluster and not caused by this PR
longwuyuan
on 27 Oct 2019
I'm not sure if dashboards for k8s 1.14 are fully compatible with 1.15.
Please test it with k8s 1.14 and with previous chart verion on k8s 1.15 - and if it works then the issue is in kubernetes-mixin.
 nvtkaszpir
on 27 Oct 2019
nvtkaszpir
on 27 Oct 2019
ok will try k8s v1.14.
But I have tested a change to the query (to undo the change done by that PR), the problem is solved on k8s 1.15.4. Just a simple edit and remove the prefix "node", added by tht PR ;
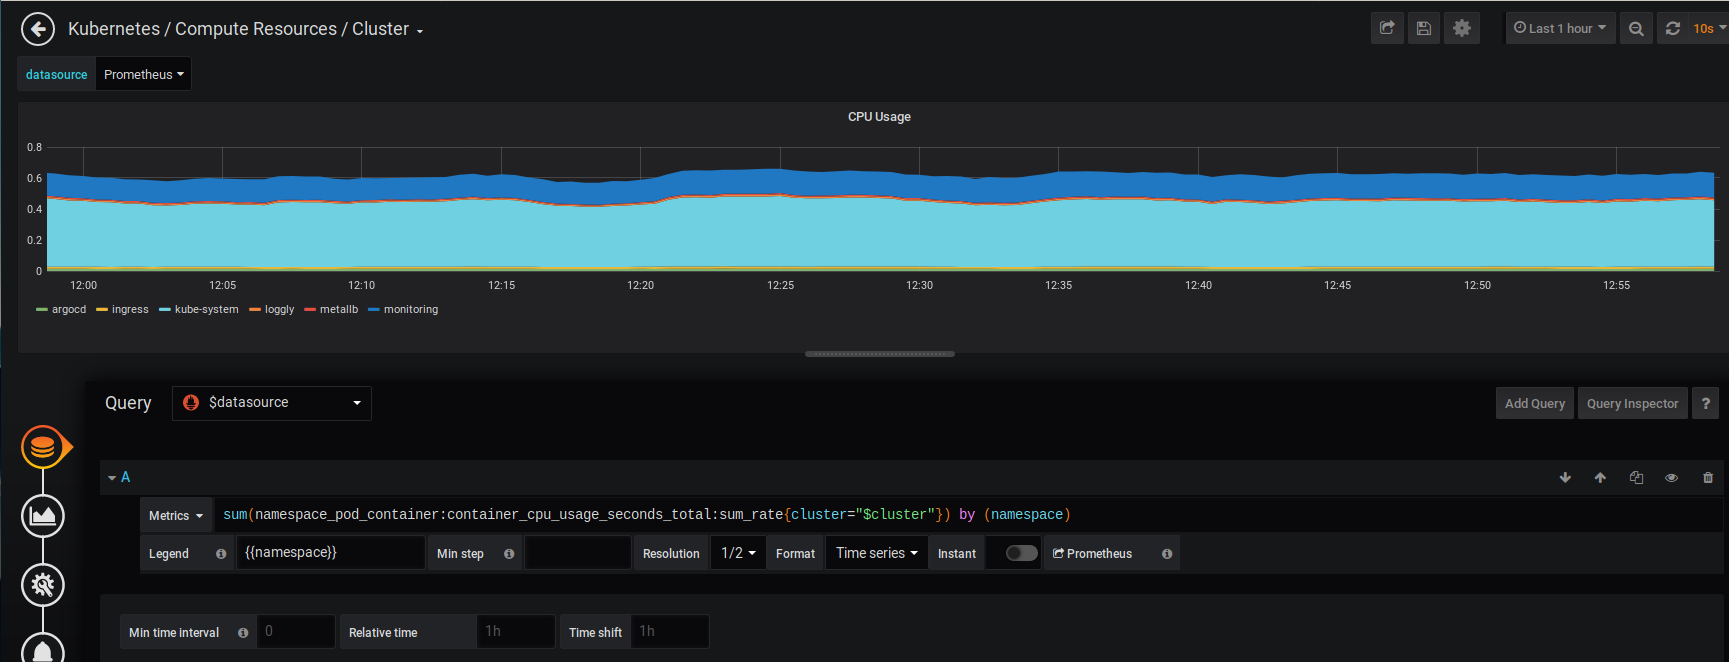
I think that not having that prefix "node" will work in all recent versions of K8s.
Would you know if this means that the PR https://github.com/helm/charts/pull/18109 was merged only with k8s v1.14 and below in mind.
longwuyuan
on 27 Oct 2019
AFAIR #18109 was following described procedure of applying changes to kubernetes/kubernetes-mixin and coreos/kube-prometheus as described in helm/charts/stable/prometheus-operator/hack/README.md. Yet I'm not aware if it was visually tested on k8s 1.15 and above, but it was for sure tested on k8s 1.13 and k8s 1.14.
I guess @kpucynski needs to shed more light in here.
nvtkaszpir
on 27 Oct 2019
Looks like this is related. Unfortunately a fix for this is currently blocked due to tests failing in the CI cluster.
 vsliouniaev
on 27 Oct 2019
vsliouniaev
on 27 Oct 2019
Hm, I went with the procedure and tested it with 1.13 and 1.14.
If the templates from upstream are not compatible now with 1.15 it will be required to add additional folder with 1.15 templates and update semver checks for them...
 kpucynski
on 27 Oct 2019
kpucynski
on 27 Oct 2019
Unfortunately AFAIR upstream repos do not keep branches for every k8s version. Only <= 1.13 and >= 1.14
If metrics are changing ever version now it will be a problem with the automated imports...
kpucynski
on 27 Oct 2019
How often do you update from upstream ?
Would you accept a PR to revert only this one metric, changed here in the chart. That way at least the chart would be usable until things get sorted out upstream.
Or would you rather have a discussion in the upstream repo.
longwuyuan
on 27 Oct 2019
It's done, in fact, on demand - there's no automation beside import scripts. I did update mainly to include relative paths in dashboards links.
Chnages in templates itself you have to discuss upstream.
kpucynski
on 27 Oct 2019
I just discovered https://github.com/coreos/kube-prometheus/issues/284 .
Any chance you can dumb it down for me. What do I do on my end to. Which script is he talking about for sync...the same one that you use to update from upstream or something I have to run on my cluster. Sorry for troubling
longwuyuan
on 27 Oct 2019
please read carefully https://github.com/helm/charts/blob/master/stable/prometheus-operator/hack/README.md#sync_grafana_dashboardspy
nvtkaszpir
on 27 Oct 2019
After reading that, it seems the sync requires a PR to the kube-prometheus repo.
I am installing from stable/prometheus-operator assuming that that sync was done by @kpucynski.
If it was, then I should have that metric, but I don't.
I have reinstalled and still don't see that metric while the old metric works.
I can only request a succint hint at what I should do to get that metric.
Please advise
longwuyuan
on 27 Oct 2019
There is a change in Kubernetes 1.14, which introduces new metrics, but does not remove the old metrics immediately. In Kubernetes 1.15 it should be only the new metrics. Dashboards which work in 1.15 would also work in 1.14.
There is a currently open large PR to sync the dashboards from the upstream repos into the Prometheus-Operator chart here: https://github.com/helm/charts/pull/18375
vsliouniaev
on 27 Oct 2019
Thank you @vsliouniaev
longwuyuan
on 28 Oct 2019
I've the same issue _(No data for CPU Usage)_ on k8s 1.16 and prometheus-operator chart 7.4.0
Edit: I just see that #18375 and #18560 aren't yet merged.
 asosso
on 5 Nov 2019
asosso
on 5 Nov 2019
Experienced similar issue here after a helm update. Kubernetes version is 1.14 EKS.
I managed to revert using helm to a previous version, now all is fine.
That previous working version is 7.0.0 (double checked the chart labels). I've pinned the chart version. Now if I run helmfile -i apply (which executes a git diff first and asks for confirmation if anything changes) I'm presented with lots of dashboard changes, for example:
monitoring, prometheus-prometheus-oper-k8s-resources-namespace, ConfigMap (v1) has changed:
- # Source: prometheus-operator/templates/grafana/dashboards/k8s-resources-namespace.yaml
- # Generated from 'k8s-resources-namespace' from https://raw.githubusercontent.com/coreos/kube-prometheus/release-0.1/manifests/grafana-dashboardDefinitions.yaml
+ # Source: prometheus-operator/templates/grafana/dashboards-1.14/k8s-resources-namespace.yaml
+ # Generated from 'k8s-resources-namespace' from https://raw.githubusercontent.com/coreos/kube-prometheus/master/manifests/grafana-dashboardDefinitions.yaml
  # Do not change in-place! In order to change this file first read following link:
  # https://github.com/helm/charts/tree/master/stable/prometheus-operator/hack
  apiVersion: v1
  kind: ConfigMap
  metadata:
    name: prometheus-prometheus-oper-k8s-resources-namespace
    labels:
      grafana_dashboard: "1"
      app: prometheus-operator-grafana

      chart: prometheus-operator-7.0.0
      release: "prometheus"
      heritage: "Tiller"
  data:
    k8s-resources-namespace.json: |-
      {
          "annotations": {
              "list": [

              ]
          },
          "editable": true,
          "gnetId": null,
          "graphTooltip": 0,
          "hideControls": false,
          "links": [

          ],
          "refresh": "10s",
          "rows": [
              {
                  "collapse": false,
                  "height": "250px",
                  "panels": [
                      {
                          "aliasColors": {

                          },
                          "bars": false,
                          "dashLength": 10,
                          "dashes": false,
                          "datasource": "$datasource",
                          "fill": 10,
                          "id": 1,
                          "legend": {
                              "avg": false,
                              "current": false,
                              "max": false,
                              "min": false,
                              "show": true,
                              "total": false,
                              "values": false
                          },
                          "lines": true,
                          "linewidth": 0,
                          "links": [

                          ],
                          "nullPointMode": "null as zero",
                          "percentage": false,
                          "pointradius": 5,
                          "points": false,
                          "renderer": "flot",
                          "seriesOverrides": [

                          ],
                          "spaceLength": 10,
                          "span": 12,
                          "stack": true,
                          "steppedLine": false,
                          "targets": [
                              {
-                                 "expr": "sum(namespace_pod_name_container_name:container_cpu_usage_seconds_total:sum_rate{cluster=\"$cluster\", namespace=\"$namespace\"}) by (pod_name)",
+                                 "expr": "sum(node_namespace_pod_container:container_cpu_usage_seconds_total:sum_rate{cluster=\"$cluster\", namespace=\"$namespace\"}) by (pod)",
                                  "format": "time_series",
                                  "intervalFactor": 2,
-                                 "legendFormat": "{{pod_name}}",
+                                 "legendFormat": "{{pod}}",
                                  "legendLink": null,
                                  "step": 10
It changes from dashboards/*.yaml to dashboards-1.14/*.yaml. Those dashboard, strangely enough, don't work, although cluster version is v1.14.6-eks-5047ed. Metrics with node_ prefix are not present in this cluster.
Anybody have a clue what the moving part or mismatch might be that introduced this breaking change?
 TBeijen
on 5 Nov 2019
TBeijen
on 5 Nov 2019
I am grateful for the extraordinary work being done on this for no remuneration. Its work in progress to address the problem. Cause of the problem is changes upstream, among other things. Look up the comments above, particularly the reference to the PR. thnx
longwuyuan
on 5 Nov 2019
18564 has been merged in but the issues persist for me.
 tiagomeireles
on 6 Nov 2019
tiagomeireles
on 6 Nov 2019
Just upgraded with the change in #18564 (version 8.0.0 of the helm chart) and fixed the issue for me.
Thanks for all the support! :)
 gsimoes
on 6 Nov 2019
gsimoes
on 6 Nov 2019
Just upgraded to version 8.1.0 and it works.
Thank you
asosso
on 6 Nov 2019
I'm on k8s 1.15.5 and the latest version of this chart but I still see the issue: No data and the node_ prefix is still there for all the charts.
Am I missing something?
admin@ip-xx-x-x-xx:~$ helm list -n monitoring
NAME                NAMESPACE   REVISION    UPDATED                                 STATUS      CHART                       APP VERSION
prometheus-operator monitoring  1           2019-12-11 21:48:27.897181637 +0000 UTC deployed    prometheus-operator-8.3.3   0.34.0

admin@ip-xx-x-x-xx:~$ kubectl version
Client Version: version.Info{Major:"1", Minor:"15", GitVersion:"v1.15.5", GitCommit:"20c265fef0741dd71a66480e35bd69f18351daea", GitTreeState:"clean", BuildDate:"2019-10-15T19:16:51Z", GoVersion:"go1.12.10", Compiler:"gc", Platform:"linux/amd64"}
Server Version: version.Info{Major:"1", Minor:"15", GitVersion:"v1.15.5", GitCommit:"20c265fef0741dd71a66480e35bd69f18351daea", GitTreeState:"clean", BuildDate:"2019-10-15T19:07:57Z", GoVersion:"go1.12.10", Compiler:"gc", Platform:"linux/amd64"}
 alterx
on 12 Dec 2019
alterx
on 12 Dec 2019
I can confirm that we are also seeing this issue on K8s 1.15.5 and the latest edition of the chart.
 pbradly
on 13 Dec 2019
pbradly
on 13 Dec 2019
Hi, we are confirming this issue too.
$ kubectl version
Server Version: version.Info{Major:"1", Minor:"15", GitVersion:"v1.15.5", GitCommit:"20c265fef0741dd71a66480e35bd69f18351daea", GitTreeState:"clean", BuildDate:"2019-10-15T19:07:57Z", GoVersion:"go1.12.10", Compiler:"gc", Platform:"linux/amd64"}

$ helm list
NAME            REVISION    UPDATED                     STATUS      CHART                       APP VERSION NAMESPACE
prom-operator   3           Fri Dec 20 14:20:15 2019    DEPLOYED    prometheus-operator-7.4.0   0.34.0      monitoring
 yusufgungor
on 27 Dec 2019
yusufgungor
on 27 Dec 2019
Same here. Using the latest chart 8.5 in AKS.
Update: Aks in not providing metrics_path label in kubelet metrics. Don't know why. After removing that from rules-1.14/k8s.yaml grafana works fine.
 rjshrjndrn
on 15 Jan 2020
rjshrjndrn
on 15 Jan 2020
Same here. Using the latest chart 8.5 in AKS.
Update: Aks in not providingmetrics_pathlabel in kubelet metrics. Don't know why. After removing that fromrules-1.14/k8s.yamlgrafana works fine.
How do you remove the "rules-1.14/k8s.yaml" ?
I am having same no data issue in AKS cluster and i see kubelet targets are down in prom
 sd2302
on 31 Jan 2020
sd2302
on 31 Jan 2020
I'm seeing this issue on k8s 1.15.3
With chart version 8.2.0 is working fine but I've tried with 8.5.4 and 8.7.0 both don't show metrics especially for CPU (pods/nodes etc.) in Grafana.
Any idea what has change since 8.2.0?
Thanks!
 metost
on 7 Feb 2020
metost
on 7 Feb 2020
i will try 8.2.0 then...and post the results
sd2302
on 7 Feb 2020
@sd2302 Sorry for the delayed response.
- Kubelets are down because, you're trying to use https for kubelet monitoring and the certificates are not mounted.
You can use http to monitor.
Add this in to your values.yaml file
```
# Enabling monitoring kubelet monitoring over http
kubelet:
serviceMonitor:
https: false
As for grafana cpu metrics,
This is what I've changed.
**prometheus-operator-8.5.8**
❮ diff -r modified-prometheus-operator upstream-prometheus-operator
diff -r prometheus-operator/templates/prometheus/rules-1.14/k8s.rules.yaml /tmp/prometheus-operator/templates/prometheus/rules-1.14/k8s.rules.yaml
25c25
< - expr: sum(rate(container_cpu_usage_seconds_total{job="kubelet", image!="", container!="POD"}[5m])) by (namespace)
- expr: sum(rate(container_cpu_usage_seconds_total{job="kubelet", metrics_path="/metrics/cadvisor", image!="", container!="POD"}[5m])) by (namespace)29c29
< rate(container_cpu_usage_seconds_total{job="kubelet", image!="", container!="POD"}[5m])
rate(container_cpu_usage_seconds_total{job="kubelet", metrics_path="/metrics/cadvisor", image!="", container!="POD"}[5m])33c33
< container_memory_working_set_bytes{job="kubelet", image!=""}
container_memory_working_set_bytes{job="kubelet", metrics_path="/metrics/cadvisor", image!=""}37c37
< container_memory_rss{job="kubelet", image!=""}
container_memory_rss{job="kubelet", metrics_path="/metrics/cadvisor", image!=""}41c41
< container_memory_cache{job="kubelet", image!=""}
container_memory_cache{job="kubelet", metrics_path="/metrics/cadvisor", image!=""}45c45
< container_memory_swap{job="kubelet", image!=""}
container_memory_swap{job="kubelet", metrics_path="/metrics/cadvisor", image!=""}48c48
< - expr: sum(container_memory_usage_bytes{job="kubelet", image!="", container!="POD"}) by (namespace)
- expr: sum(container_memory_usage_bytes{job="kubelet", metrics_path="/metrics/cadvisor", image!="", container!="POD"}) by (namespace)```
If you want the exact file : https://github.com/rjshrjndrn/sunbird-devops/blob/release-2.8.0/kubernetes/helm_charts/monitoring/prometheus-operator/templates/prometheus/rules-1.14/k8s.rules.yaml
Download it and replace with the original one, you'll get the cpu metrics
rjshrjndrn
on 15 Feb 2020
I'm seeing this issue in 8.12.1.
 marshallford
on 14 Mar 2020
marshallford
on 14 Mar 2020
I 'am seeing the same issue with :
- helm chart prometheus-operator
8.12.2 - kubernetes
1.14(EKS)
The dashboard Kubernetes / Compute Resources / Cluster works fine just after deploying the chart.. After a while, we start losing metric by metric starting CPU Usage, until we reached this dashboard:
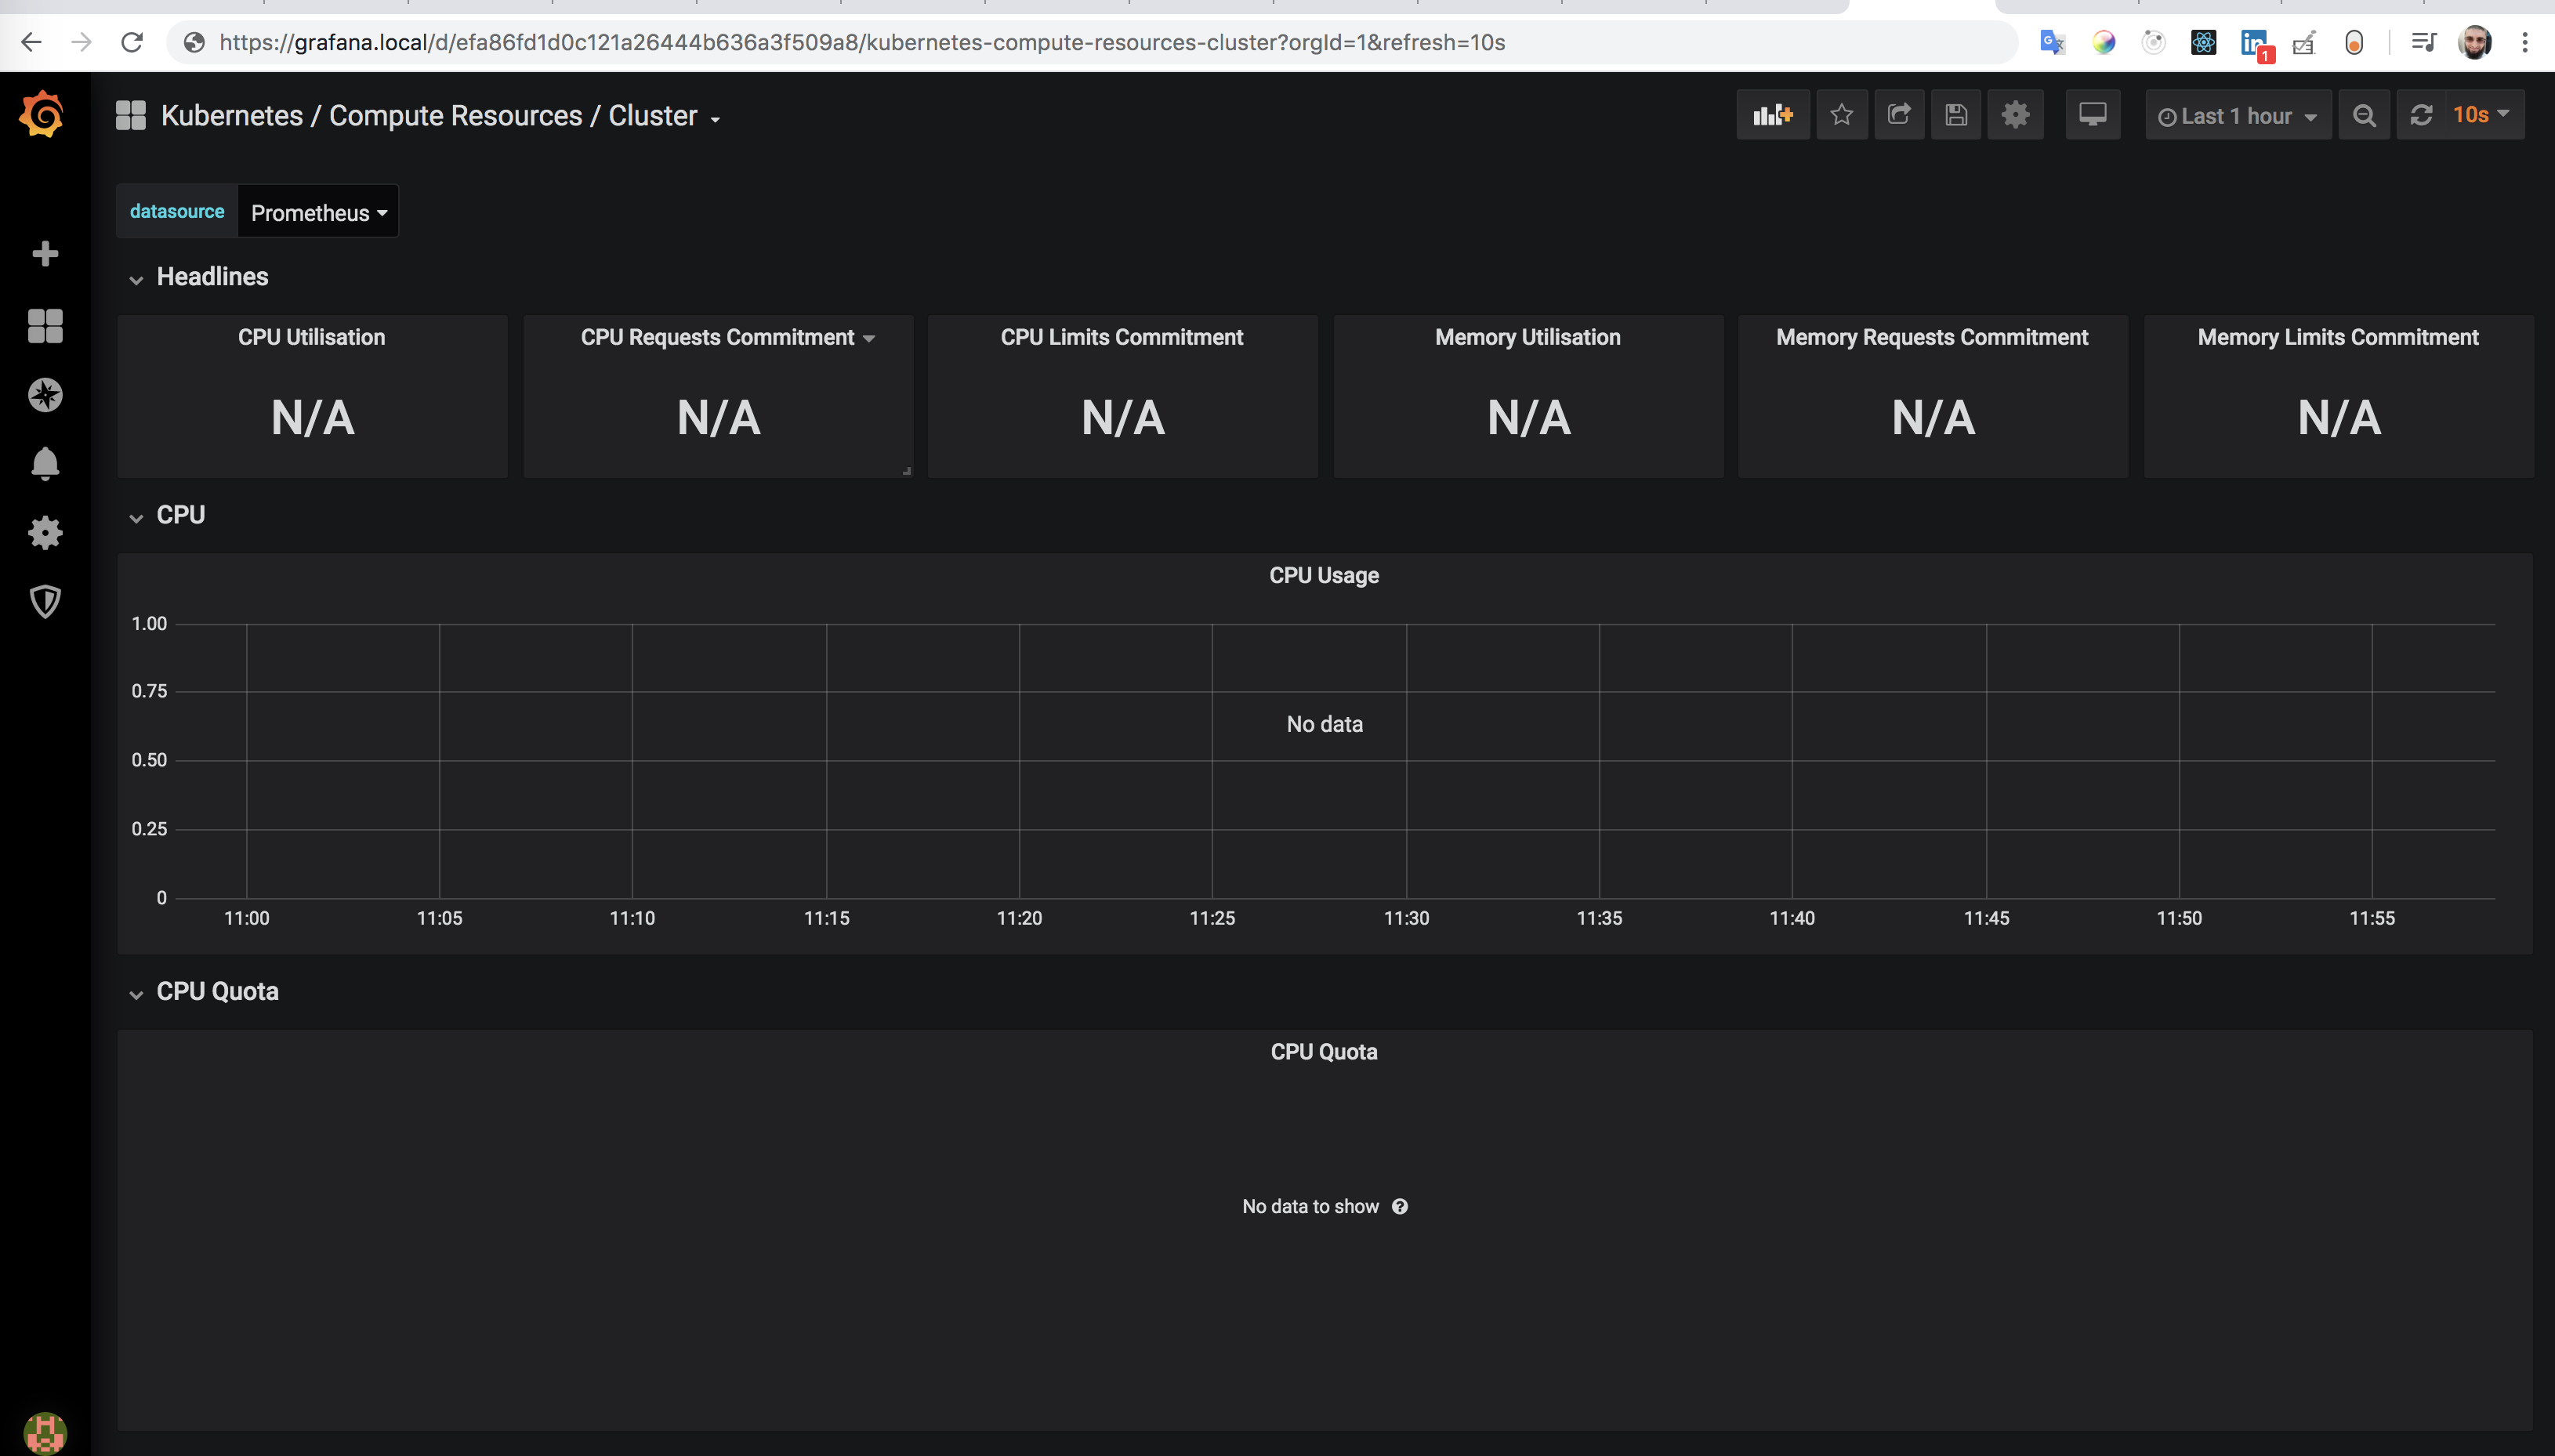
I am gonna downgrade the chart because the first time we installed the chart was at July 2019. Our mistake that we didn't pin the version.
 abdennour
on 27 Mar 2020
abdennour
on 27 Mar 2020
I returned back to you immediately thanks to our Helmfile. While we are not using it because it is not stable, but we still save on it some metadata of Helm releases.
Then, I found this golden line
version: ~6.7.4
🎉
k8s 1.14 + chart 6.7.4 works fine
abdennour
on 27 Mar 2020
Is there a fix for installing the chart on a 1.15 cluster and getting cpu/memory usage?
 rexroof
on 9 Apr 2020
rexroof
on 9 Apr 2020
We are seeing this issue on k8s 1.14 (EKS) and chart version 8.13.0. Can this be reopened? I'd rather not have to downgrade to a chart version 2 major releases old...
 edshelton
on 24 Apr 2020
edshelton
on 24 Apr 2020
I've noticed this issue when deploying the chart using Helm v3 into a k8s 1.13 (gke) cluster. It seems like it did not pick the proper <1.14 dashboards. The new dashboards are using this pod label (which is pod_name in 1.13). I am wondering if something changed in the way this .Capabilities.KubeVersion.GitVersion is supposed to work.
The workaround was to set kubeTargetVersionOverride: "1.13.7"
 acondrat
on 27 Apr 2020
acondrat
on 27 Apr 2020
bump
 Morriz
on 4 May 2020
Morriz
on 4 May 2020
We're missing CPU usage metrics on all dashboards - currently running EKS v1.16 and Helm chart 8.5.9
 mogggggg
on 21 May 2020
mogggggg
on 21 May 2020
We're missing Kubernetes / Compute Resources / * metrics
EKS version: v1.15.11-eks-af3caf
prometheus-operator helm chart version: 8.15.5
 andyyaldoo
on 19 Jun 2020
andyyaldoo
on 19 Jun 2020
Same thing.
prometheus-operator 8.15.6
 gfrntz
on 25 Jun 2020
gfrntz
on 25 Jun 2020
Hey I am using the 8.15.6 chart and k8s version v1.15.2 and I cant see CPU data on Grafana .. Also cant see kubelet data too in the kubelet dashboard too.. All the service monitors are in green state (including the kubelet). Any fix for this?
 dileekafernando
on 30 Jun 2020
dileekafernando
on 30 Jun 2020
We're missing
Kubernetes / Compute Resources / *metricsEKS version: v1.15.11-eks-af3caf
prometheus-operator helm chart version: 8.15.5
Just an update here. In my case, I was installing the prometheus-operator helm chart using argocd and provided a custom release name. Since the app.kubernetes.io/instance label is always overriden by argocd, this cause a mismatch between the selector in the ServiceMonitor and the label for the Service. After I fixed the label-selector mismatch by removing the custom release name (use the argocd application name instead), the metrics start coming in.
More info: https://argoproj.github.io/argo-cd/user-guide/helm/#helm-release-name
andyyaldoo
on 30 Jun 2020
I am experiencing similar issues with AKS version 1.16.19 with prom-operator chart version 8.15.8, none of the charts seems to be loading. Has anyone successfully installed this on AKS 1.16.19?
 lakovmartin
on 7 Jul 2020
lakovmartin
on 7 Jul 2020
Same issue with chart 8.2.0 and k8s 1.16 on azure. No metrics data. Bummer.
Morriz
on 10 Jul 2020
Just updated to latest 8.15.14 chart, still no cpu metrics
Morriz
on 10 Jul 2020
No network data either. 8.2.0 chart on k8s 1.15 was working fine and dandy ;|
Morriz
on 10 Jul 2020
No network data either. 8.2.0 chart on k8s 1.15 was working fine and dandy ;|
yep same for me on 1.16.19, worked fine on AKS 1.15.10 with chart 8.1.2. Just wondering if anyone has a fix for this or a working chart version
lakovmartin
on 10 Jul 2020
Btw, this issue seems duplicated here: #19597
Morriz
on 10 Jul 2020
Same issue with GKE 1.16.9 and chart 9.3.0
 jesussancheztellomm
on 4 Aug 2020
jesussancheztellomm
on 4 Aug 2020
SAME ISSUE!! chart 9.3.1 prometheus-operator, k8s 1.17.9 it happens also... do you know what could be solution?
sum(node_namespace_pod_container:container_cpu_usage_seconds_total:sum_rate{cluster="$cluster"}) by (namespace)
 nkol
on 19 Aug 2020
nkol
on 19 Aug 2020
This chart and the whole repo is obsolete. Check: https://github.com/prometheus-community/helm-charts/tree/main/charts/kube-prometheus-stack
kpucynski
on 6 Oct 2020
this thread should be locked
cc @unguiculus
nvtkaszpir
on 6 Oct 2020
Related issues
 dene14
·
3Comments
dene14
·
3Comments
 ChrisCooney
·
3Comments
ChrisCooney
·
3Comments
 onyxet
·
3Comments
onyxet
·
3Comments
 tdcox
·
3Comments
vsliouniaev
·
3Comments
tdcox
·
3Comments
vsliouniaev
·
3Comments
Most helpful comment
Is there a fix for installing the chart on a 1.15 cluster and getting cpu/memory usage?