Charts: Cant able to set XAxis Range for custom DateTime formatter
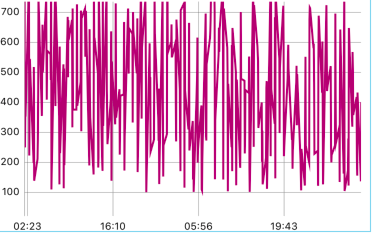
I have created a line graph with Date Time format on X Axis.The values are plotting correctly,but i would like to be shown 1 hour interval based.Right now its showing directly the xvalue as ranges.Can anyone help how to set ranges for this, i am struck for almost a day in this.Thanks
let xAxis = self.chartView.xAxis
xAxis.labelFont = .systemFont(ofSize: 10)
xAxis.labelTextColor = .black
xAxis.drawAxisLineEnabled = false
xAxis.valueFormatter = DateValueFormatter()
public class DateValueFormatter: NSObject, IAxisValueFormatter {
private let dateFormatter = DateFormatter()
override init() {
    super.init()
    dateFormatter.dateFormat = "HH:mm"
}

public func stringForValue(_ value: Double, axis: AxisBase?) -> String {
    return dateFormatter.string(from: Date(timeIntervalSince1970: value))
}
}
 leniyadav
All 4 comments
@leniyadav i have same issue. have you find any solution?
 shahchirag2110
on 11 Jun 2018
shahchirag2110
on 11 Jun 2018
@shahchirag Still have the issue.Do let me know if you find any solution.Thanks
leniyadav
on 11 Jun 2018
@shahchirag2110 @leniyadav have you guys found any solution? Thanks
 PedroJoaoRibeiro
on 22 Jun 2018
PedroJoaoRibeiro
on 22 Jun 2018
please ask on stack overflow.
 liuxuan30
on 22 Jun 2018
liuxuan30
on 22 Jun 2018
Related issues
 sjdevlin
·
3Comments
sjdevlin
·
3Comments
 Shunshine07
·
3Comments
Shunshine07
·
3Comments
 anhltse03448
·
3Comments
anhltse03448
·
3Comments
 deepumukundan
·
3Comments
deepumukundan
·
3Comments
 BrandonShega
·
4Comments
BrandonShega
·
4Comments