Charts: How to remove Right side vertical line and values in LineChartView
Hi @danielgindi ,
I would like to create chart view for finance. First time am using "Charts", It is more interesting to use this library. But Having some doubts. Please clarify for me. Thanks in advance.
What did you do?
I would like to create lineChartView with cubic mode and filled with color. I tried your example code and created a chart. FYI I mentioned my codes below.
func setChart() {
        // Define the reference time interval
        var referenceTimeInterval: TimeInterval = 0
        if let minTimeInterval = (dataPointsValue.map { $0.xDate.timeIntervalSince1970 }).min() {
            referenceTimeInterval = minTimeInterval
        }

        // Define chart xValues formatter
        let formatter = DateFormatter()
        formatter.dateFormat = DateFormate.Formate7.rawValue
        formatter.locale = Locale.current

        let xValuesNumberFormatter = ChartXAxisFormatter(referenceTimeInterval: referenceTimeInterval, dateFormatter: formatter)

        // Define chart entries
        var entries = [ChartDataEntry]()
        for object in dataPointsValue {
            let timeInterval = object.xDate.timeIntervalSince1970
            let xValue = (timeInterval - referenceTimeInterval) / (3600 * 24)

            let yValue = object.value
            let entry = ChartDataEntry(x: xValue, y: yValue!)
            entries.append(entry)
        }

        // Define Coloring
        let color = Color.primaryColor.value

        // Define the Data Sets
        let lineChartDataSet = LineChartDataSet(values: entries, label: "")
        let lineChartData = LineChartData(dataSets: [lineChartDataSet])

        // Draw as Cubic
        lineChartDataSet.mode = .cubicBezier

        // Fill Graph
        lineChartDataSet.drawFilledEnabled = true

        // Color Graph
        lineChartDataSet.colors = [color]

        // Set Defined Data to Chart View
        m_ChartView.data = lineChartData

        // Set xAxis label position in Bottom
        m_ChartView.xAxis.labelPosition = .bottom

        // Animate the Chart in Intial Load
        m_ChartView.animate(xAxisDuration: 2.0, yAxisDuration: 2.0, easingOption: .easeInCubic)

        // Remove Coordinate Circles
        lineChartDataSet.drawCirclesEnabled = false

        // Remove xAxis Line
        m_ChartView.xAxis.drawGridLinesEnabled = false
        m_ChartView.xAxis.drawAxisLineEnabled = false

        // Set Date Formatter for xAxis Bottom Label
        m_ChartView.xAxis.valueFormatter = xValuesNumberFormatter

        // Hide Legend Square
        m_ChartView.legend.enabled = false

        //remove description
        m_ChartView.chartDescription?.text = ""
    }
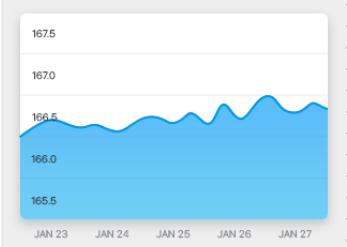
What did you expect to happen?
My expectation to create a chart like below mentioned image.
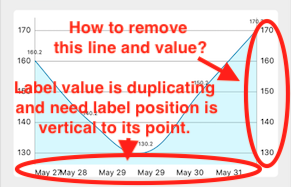
What happened instead?
But I got my output as below mentioned image.

Please guide me to fix below mentioned image.
Charts Environment
Charts version/Branch/Commit Number: 3.1.1 (Using via pod)
Xcode version: 9.2
Swift version: Swift 4.0
Platform(s) running Charts: iOS 10 & above
macOS version running Xcode: macOS High Sierra Version 10.13.1
I requested the same question in stackoverflow.
 muthusabarinathan
All 5 comments
try
m_ChartView.rightAxis.enabled = false
and look at #3069
 thierryH91200
on 31 May 2018
thierryH91200
on 31 May 2018
thierryH91200
on 31 May 2018
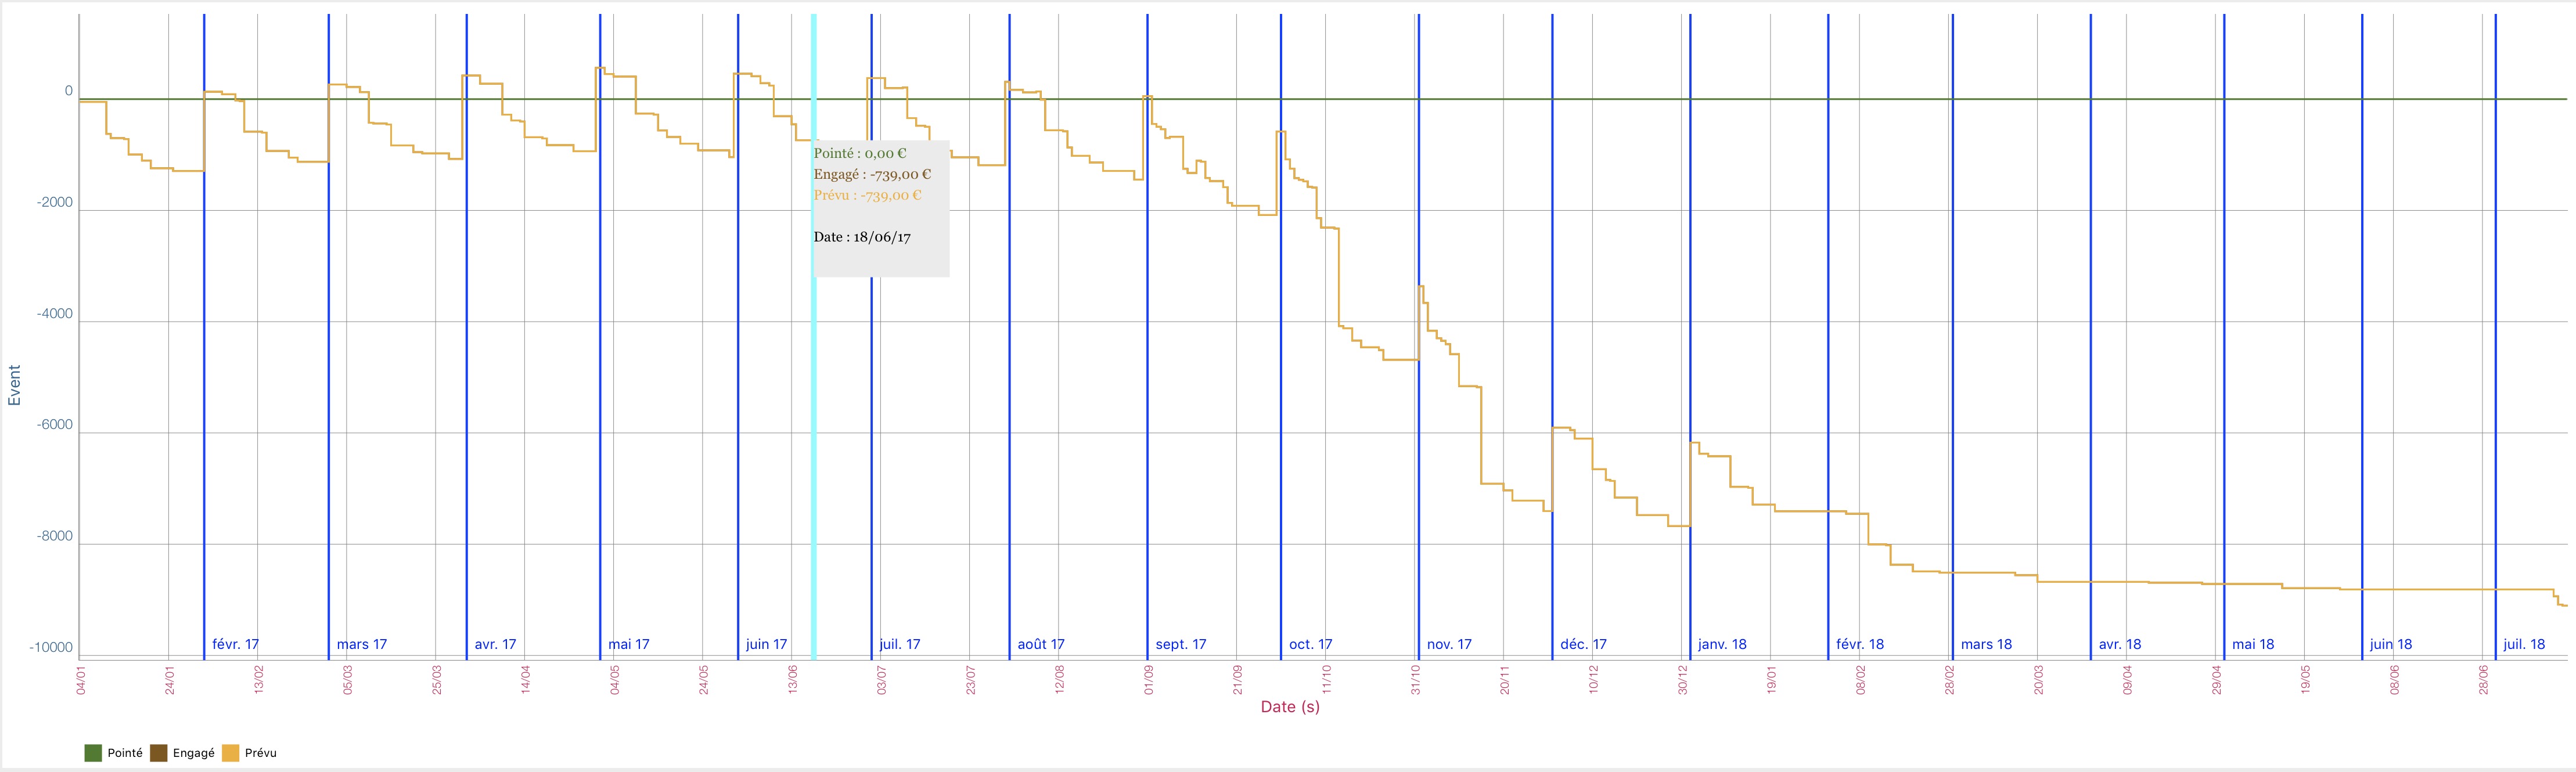
@thierryH91200 - Thank you so much for your quick help. It is perfectly working. But I need one more thing, please see the image.
muthusabarinathan
on 31 May 2018
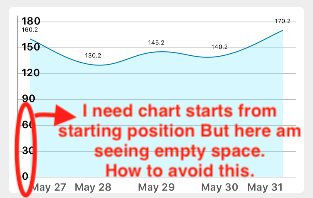
there is a lack of documentation I think
modify or add
m_ChartView.leftAxis.axisMaximum = x2
m_ChartView.leftAxis.axisMinimum = x1
thierryH91200
on 31 May 2018
@thierryH91200 - Thanks you so much. It is perfectly working. But I changed leftAxis to xAxis.
muthusabarinathan
on 31 May 2018
Related issues
 heumn
·
3Comments
heumn
·
3Comments
 coop44483
·
3Comments
coop44483
·
3Comments
 guoyutaog
·
3Comments
guoyutaog
·
3Comments
 deepumukundan
·
3Comments
deepumukundan
·
3Comments
 guanyanlin
·
3Comments
guanyanlin
·
3Comments
Most helpful comment
try
m_ChartView.rightAxis.enabled = false
and look at #3069