Charts: [stable/jenkins] Agent/Slave disconnects randomly during build
Every so often when a job is invoked, a Jenkins slave will be spun up, but it won't complete the job properly, even sometimes erroring before the job actually even starts.
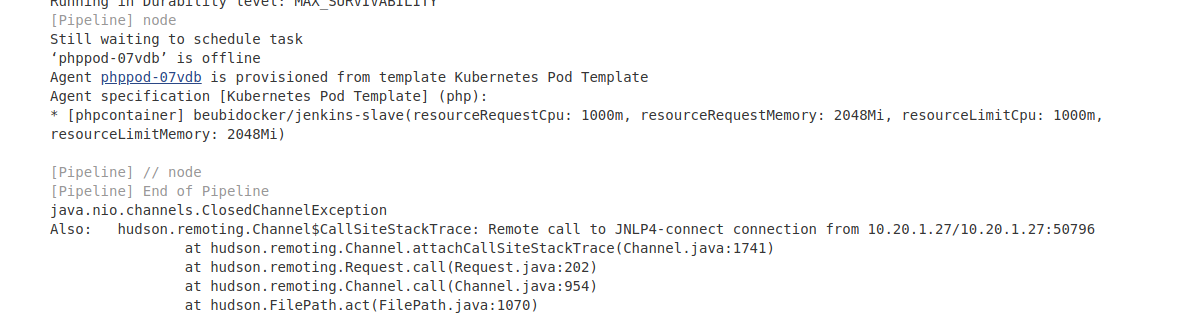
Agent went offline during the build
Build step 'Execute shell' marked build as failure
FATAL: Remote call on JNLP4-connect connection from 100.122.0.2/100.122.0.2:47648 failed. The channel is closing down or has closed down
java.nio.channels.ClosedChannelException
    at org.jenkinsci.remoting.protocol.NetworkLayer.onRecvClosed(NetworkLayer.java:154)
    at org.jenkinsci.remoting.protocol.impl.NIONetworkLayer.ready(NIONetworkLayer.java:142)
    at org.jenkinsci.remoting.protocol.IOHub$OnReady.run(IOHub.java:721)
    at jenkins.util.ContextResettingExecutorService$1.run(ContextResettingExecutorService.java:28)
    at java.util.concurrent.ThreadPoolExecutor.runWorker(ThreadPoolExecutor.java:1149)
    at java.util.concurrent.ThreadPoolExecutor$Worker.run(ThreadPoolExecutor.java:624)
    at java.lang.Thread.run(Thread.java:748)
Caused: hudson.remoting.ChannelClosedException: Remote call on JNLP4-connect connection from 100.122.0.2/100.122.0.2:47648 failed. The channel is closing down or has closed down
    at hudson.remoting.Channel.call(Channel.java:901)
    at hudson.Launcher$RemoteLauncher.kill(Launcher.java:1079)
    at hudson.model.AbstractBuild$AbstractBuildExecution.run(AbstractBuild.java:510)
    at hudson.model.Run.execute(Run.java:1724)
    at hudson.model.FreeStyleBuild.run(FreeStyleBuild.java:43)
    at hudson.model.ResourceController.execute(ResourceController.java:97)
    at hudson.model.Executor.run(Executor.java:421)
Finished: FAILURE
I am not actually doing anything in the job (I'm still building it but have parameter verification steps in there)
Using Spots vs On Demand instances makes no difference.
Increasing timeout on the Jenkins master ELB makes no difference.
 huang-jy
All 49 comments
Example:
node {
    docker.image('blenderfox/xenial-base').inside('-u root') {
        stage('Configure Environment') {
                sh '''
                        # Any stuff you need to do to the pod before the job runs, put here
                        # for example, any repos you want, CLI tools, etc.
                        '''
        }
    }
}
This works on a normal Jenkins installation on EC2 (non-Kubernetes)
When copy-pasted into Jenkins installed via helm, it randomly times out during startup.
However, this does work (using the Kubernetes plugin):
node {
    kubernetes.pod('test-pod').withImage('blenderfox/xenial-base').inside {
        stage('Configure Environment') {
                sh '''
                        # Any stuff you need to do to the pod before the job runs, put here
                        # for example, any repos you want, CLI tools, etc.
                        '''
        }
    }
}
However, this has the side effect of spinning up an additional pod -- one for the agent, and another for the docker container.
huang-jy
on 22 Feb 2018
Issues go stale after 90d of inactivity.
Mark the issue as fresh with /remove-lifecycle stale.
Stale issues rot after an additional 30d of inactivity and eventually close.
If this issue is safe to close now please do so with /close.
Send feedback to sig-testing, kubernetes/test-infra and/or fejta.
/lifecycle stale
 fejta-bot
on 23 May 2018
fejta-bot
on 23 May 2018
Guess no-one else has encountered this :(
huang-jy
on 23 May 2018
I encounter this quite often. When running the job as a pipeline the pipeline ends up hung forever cause the agent will never return. Very frustrating.
UPDATE 06/04/2018: Realized today this is the Helm charts repo for Kubernetes and should have posted on official Jenkins ticketing system because we are not using Helm for Jenkins at this time.
 ghost
on 26 May 2018
ghost
on 26 May 2018
And as yet, no indication as to why/how to fix it :(
huang-jy
on 26 May 2018
I am waiting for a fix too.
 spezifanta
on 30 May 2018
spezifanta
on 30 May 2018
Me too..
 iamshital
on 2 Jun 2018
iamshital
on 2 Jun 2018
Clearly I did not pay attention to what repo this issue was created against. This is a helm repo but the issue is a Jenkins issue as far as I can tell, thus I recommend we move the conversation to https://issues.jenkins-ci.org/browse/JENKINS-48895
ghost
on 4 Jun 2018
I don't think it is Jenkins, as the same job runs totally fine on a Jenkins installation that is not in Kubernetes. And neither Jenkins is on v2.9 as mentioned in that referenced ticket.
huang-jy
on 4 Jun 2018
Removing stale as this issue is still outstanding with no evidence of being fixed
/remove-lifecycle stale
huang-jy
on 15 Jun 2018
https://github.com/kubernetes/charts/issues/6271#issuecomment-400437969
Possible solution
huang-jy
on 26 Jun 2018
@huang-jy , thank you for providing information on your possible solution. May I ask, what are you sharing is the solution here? The CPU request being set to "1" rather than "1000m" or similar? Or perhaps the memory requested?
I have allocated 3000m & 9600mi respectively to Jenkins Master in our cluster yet still encounter the random disconnect. So I ask in hope that you've recognized something I have not recognized.
ghost
on 26 Jun 2018
No, the default setting for Jenkins in the chart was something like 200m cpu and 500Mi memory. In https://issues.jenkins-ci.org/browse/JENKINS-50132, there was a comment that increasing the requested resource fixed the problem for them.
huang-jy
on 26 Jun 2018
@sbeckwithiii also try increasing the jnlp requests.
huang-jy
on 26 Jun 2018
For other users with this problem, copy-pasted from other issue:
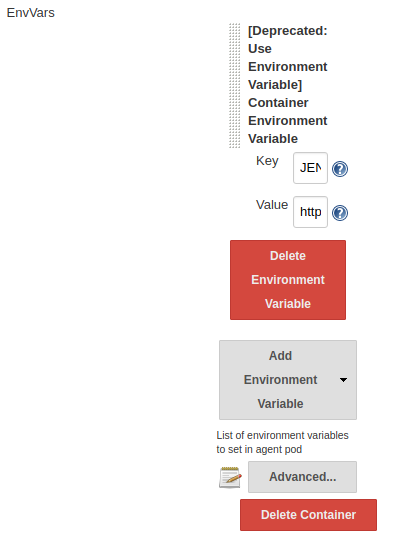
Under http://jenkins-master/configure, look for tthe "Cloud -> Kubernetes -> Images -> Kubernetes Pod Section -> Containers" section, and you'll see the settings for the images -- one for the master and one for the slave.
Under the slave settings, there's a button labelled "Advanced" (it's just above the "Delete Container" button). Click that, and you'll see the resource request values
huang-jy
on 3 Jul 2018
I have encountered this as well, in Kubernetes, with the plugin. It will spin up an instance and the job will terminate as its running. Very simple stuff like echo "Hello World"; sleep 30; ls -al /
I get the following:
Caused: java.io.IOException: Backing channel 'JNLP4-connect connection from 100.116.0.7/100.116.0.7:54192' is disconnected.
 darenjacobs
on 11 Jul 2018
darenjacobs
on 11 Jul 2018
Have you tried increasing the resource requests as per https://github.com/kubernetes/charts/issues/3723#issuecomment-402112213 ?
huang-jy
on 11 Jul 2018
This issue has been automatically marked as stale because it has not had recent activity. It will be closed if no further activity occurs. Any further update will cause the issue/pull request to no longer be considered stale. Thank you for your contributions.
![stale[bot] picture](https://avatars.githubusercontent.com/in/1724?v=4&s=40) stale[bot]
on 19 Aug 2018
stale[bot]
on 19 Aug 2018
Hi folks, we just started hitting this. Our jnlp has no resource limitations. @huang-jy did you find out anything else about this?
My jnlp spec is as follows:
image: jenkins/jnlp-slave:alpine
imagePullPolicy: IfNotPresent
name: jnlp
resources: {}
 antweiss
on 6 Nov 2018
antweiss
on 6 Nov 2018
@antweiss Try setting the resource request for cpu and memory to something so that the defaults aren't used?
huang-jy
on 6 Nov 2018
Hello @huang-jy i put the resources that you recommend and still occur the same error! Maybe you share another solution? Or, for example, what should be the resources of Jenkins master?
 ricardompcarvalho
on 4 Dec 2018
ricardompcarvalho
on 4 Dec 2018
I had 1G+ of mem set on mine, make sure you have at least that on your node size has enough to handle that increase.
huang-jy
on 4 Dec 2018
@huang-jy look !! 
ricardompcarvalho
on 4 Dec 2018
my nodes :

ricardompcarvalho
on 4 Dec 2018
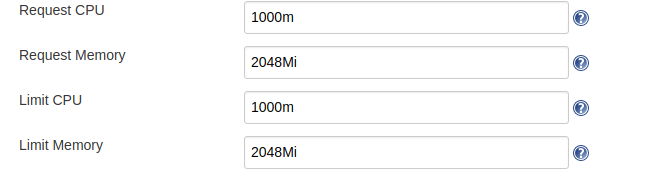
HAve you tried 1000m CPU and 2048Mi memory?
And remember to set it on the SLAVE config, not the master config.
https://github.com/helm/charts/issues/3723#issuecomment-402112213
huang-jy
on 4 Dec 2018
Also look at https://github.com/helm/charts/issues/6271#issuecomment-400437969
huang-jy
on 4 Dec 2018
@huang-jy look, the same error :s
I must do something before build again?
ricardompcarvalho
on 4 Dec 2018
@ricardompcarvalho Your jenkins endpoint is publicly accessible, you may wish to change that -- like, NOW, or at least respin it to get a new IP.
Regarding your problem, I don't think that's the right location.
The default docker image for the agent/slave is jenkinsci/jnlp-slave
Let me copy in the comment from the other ticket:
under http://jenkins-master/configure, look for tthe "Cloud -> Kubernetes -> Images -> Kuernetes Pod Section -> Containers" section, and you'll see the settings for the images -- one for the master and one for the slave.
Under the slave settings, there's a button labelled "Advanced" (it's just above the "Delete Container" button). Click that, and you'll see the resource request values
huang-jy
on 4 Dec 2018
@huang-jy my endpoint is public acessible but can you enter?
ricardompcarvalho
on 4 Dec 2018
No, luckily :)
huang-jy
on 4 Dec 2018
Yes, thatś because i use security although the endpoint is public!!
ricardompcarvalho
on 4 Dec 2018
Can you give a solution for my problem? I put the configuration of resources in the right spot @huang-jy
ricardompcarvalho
on 4 Dec 2018
The solution I had was to increase the resource requests for the slave, if that is not working for you, then you are probably having a different issue.
huang-jy
on 4 Dec 2018
I just spun up a clean Jenkins install using:
helm install --name jenkins-jo stable/jenkins --version 0.25.0
I logged in, went to Manage Jenkins, then went to Configure System.
I scrolled down to "Cloud" section

Then a bit further down....

Just past this is the button I'm talking about:
Click on "Advanced" here:
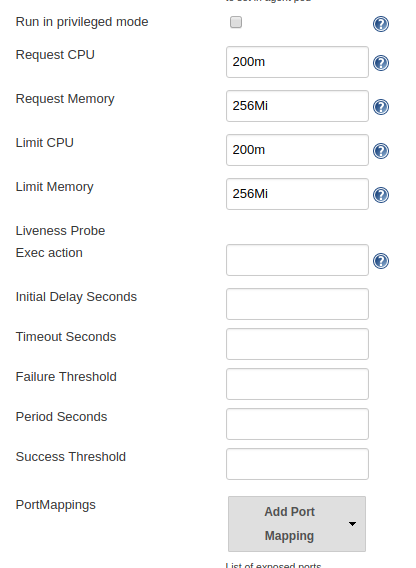
This is where you change it. As you can see the values differs quite drastically from your screenshot
huang-jy
on 4 Dec 2018
@huang-jy i know, i change where you refer!!!
ricardompcarvalho
on 4 Dec 2018
One other option to try is to reinstall (or install a new copy of) the chart and use the Agent.resources override via the --set switch to make absolutely sure it's in the right place. (Might want to try this on a fresh installation before removing your current one)
huang-jy
on 4 Dec 2018
@huang-jy yes i know, i install my jenkins via helm but i install via YAML instead putting the --set! Thanks for helping me
ricardompcarvalho
on 4 Dec 2018
@ricardompcarvalho That's fine, instead of using --set you can change the values in your yaml
huang-jy
on 4 Dec 2018
@huang-jy i know, that what i been use, but if i install through yaml if I do not define an agent in yaml it creates me an agent, I think it is pre-defined in the chart
ricardompcarvalho
on 4 Dec 2018
Yes, it'll create a config for an agent for you, if you dont' define one, it'll use the chart defaults. And that's possibly where you're getting caught out. Even on my cluster here with pure defaults, the Jenkins master keeps crashing out with OOMKilled
huang-jy
on 4 Dec 2018
My jenkins master always say that he not have minimum availability :s thanks for the help, i think :D
ricardompcarvalho
on 4 Dec 2018
Hi all,
I found the fatal reason at my k8s cluster. I installed Jenkins using helm too.
There are limits resources according to @huang-jy .

But, it didn't work for me even if I left blank.
The "Allocate pseudo-TTY" setting is decisive! The pipeline started after clicked the checkbox.

 javafoot
on 14 Dec 2018
javafoot
on 14 Dec 2018
I don't think you need that set (I didn't have that ticked) -- though I guess it depends on what your pipeline is trying to do....
And removing the request/limit stuff will just revert it to the defaults of your cluster so it might work for some people who have set high defaults, and not others whoc have set lower defaults.
huang-jy
on 14 Dec 2018
I am getting this. I believe my pods have enough resources. And even if it is a pod resource issue, it would be good if the stage would fail or restart the test when this happens. Kubernetes, by its nature, has nodes that get scaled down or otherwise go away, and if Jenkins is to be run in the Kubernetes environment (which is generally a good fit), then it should do this.
 nroose
on 8 May 2019
nroose
on 8 May 2019
@nroose the issue here is that the pods have enough resource to START but not enough to do what they need to do. In my case, when I monitored the pods at the started, the default values of the chart caused the slave to be killed by the cluster with OOMKilled. Increasing the requested resources allowed the slave to do its job.
huang-jy
on 10 May 2019
I am also facing issue as "jnlp connection disconnected",
we are using ec2 container service for this, Appreciate help a lot ..
FATAL: command execution failed
java.nio.channels.ClosedChannelException
at org.jenkinsci.remoting.protocol.NetworkLayer.onRecvClosed(NetworkLayer.java:154)
at org.jenkinsci.remoting.protocol.impl.NIONetworkLayer.ready(NIONetworkLayer.java:142)
at org.jenkinsci.remoting.protocol.IOHub$OnReady.run(IOHub.java:795)
at jenkins.util.ContextResettingExecutorService$1.run(ContextResettingExecutorService.java:28)
at jenkins.security.ImpersonatingExecutorService$1.run(ImpersonatingExecutorService.java:59)
at java.util.concurrent.ThreadPoolExecutor.runWorker(ThreadPoolExecutor.java:1149)
at java.util.concurrent.ThreadPoolExecutor$Worker.run(ThreadPoolExecutor.java:624)
at java.lang.Thread.run(Thread.java:748)
Caused: java.io.IOException: Backing channel 'JNLP4-connect connection from ip-1-x-x-x' is disconnected.
 tejas12356
on 7 Oct 2019
tejas12356
on 7 Oct 2019
@tejas12356 please verify the settings as described earlier in the thread, and make sure you're using the latest version of the chart to pick up the PR changes described in #17168
huang-jy
on 7 Oct 2019
I also had this issue while building my project, quite frustrated.
At first, I think it's related to the pod resource and tried to config K8s and Jenkins to adapt it. However, it does not solve the issue.
Then while checking the docker resource while building, I realized that the issue happens because of Docker container lack disk amount resources. After increase container memory, everything works fine.
Maybe in some cases, it's the root cause.
 Snaacker
on 12 Nov 2019
Snaacker
on 12 Nov 2019
I also had this issue while building my project, quite frustrated.
At first, I think it's related to the pod resource and tried to config K8s and Jenkins to adapt it. However, it does not solve the issue.
Then while checking the docker resource while building, I realized that the issue happens because of Docker container lack disk amount resources. After increase container memory, everything works fine.
Maybe in some cases, it's the root cause.
https://github.com/helm/charts/issues/3723#issuecomment-402112213
huang-jy
on 12 Nov 2019
Related issues
 donkeyx
·
3Comments
donkeyx
·
3Comments
 out-of-band
·
3Comments
out-of-band
·
3Comments
 tdcox
·
3Comments
tdcox
·
3Comments
 paskal
·
3Comments
paskal
·
3Comments
 kminehart
·
3Comments
kminehart
·
3Comments
Most helpful comment
For other users with this problem, copy-pasted from other issue:
Under http://jenkins-master/configure, look for tthe "Cloud -> Kubernetes -> Images -> Kubernetes Pod Section -> Containers" section, and you'll see the settings for the images -- one for the master and one for the slave.
Under the slave settings, there's a button labelled "Advanced" (it's just above the "Delete Container" button). Click that, and you'll see the resource request values