I'm trying to draw a filled line chart, you guys can see the picture for more clarity.
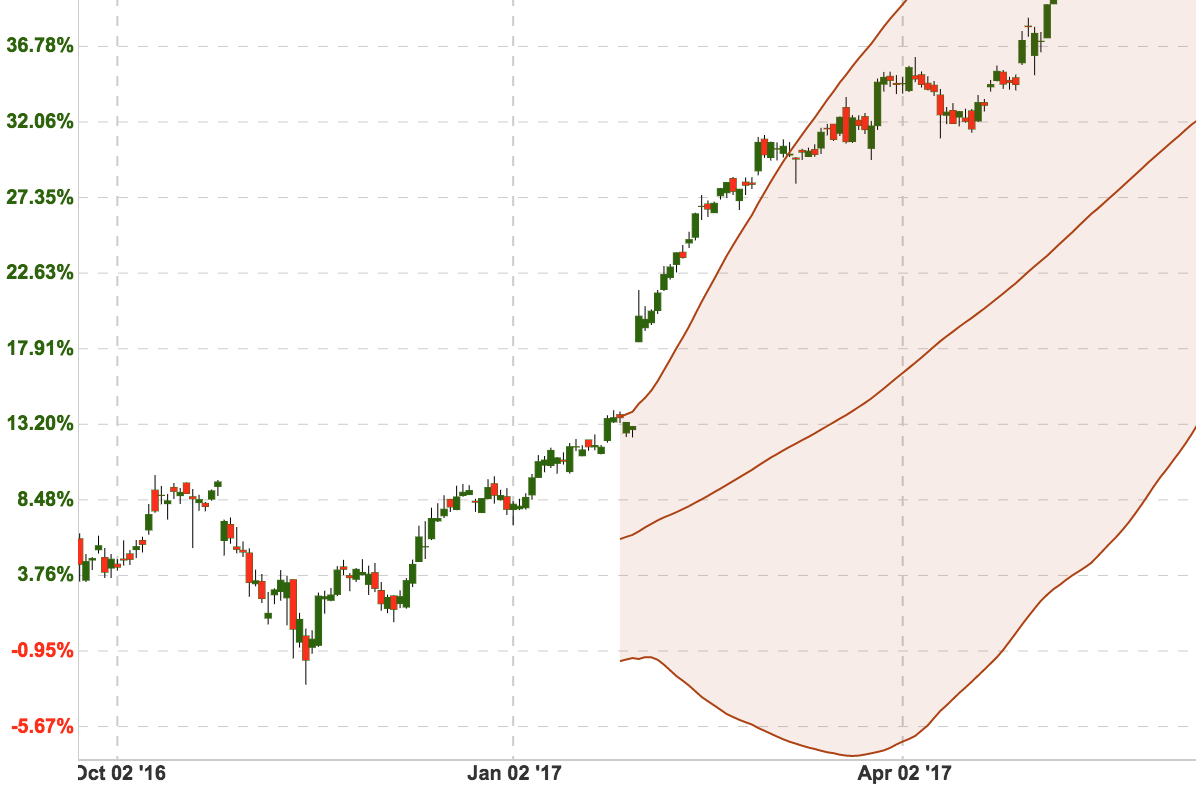
So, I saw the example and they are using IFillFormatter protocol to get y-axis position where the filled line of dataset end. But, it was a fixed position, not dynamic at all. How can I can this position depend on the each element of dataset. For instance, if index == 0 then we have a the end of filled position A, if index == 1 then we have a different end value of a filled position.
Or, any other suggestion to draw a chart like the picture above.
 sunynator
All 17 comments
take a look at drawLinearFill where it draw the fill rect. It calculates the fill rect within generateFilledPath and getFillLinePosition. ideally you should override those methods to get your rect between lines, you are good to go
 liuxuan30
on 25 Oct 2017
liuxuan30
on 25 Oct 2017
I managed to achieve this by following @liuxuan30 's suggestions by subclassing LineChartRenderer and adding a variable to the class implementing IFillFormatter, which let's me pass a second data set as indicator for the fill line and draw the path accordingly (only for linear, but I assume you could do the same thing for Bezier).
class AreaFillFormatter: IFillFormatter {

    var fillLineDataSet: LineChartDataSet?

    init(fillLineDataSet: LineChartDataSet) {
        self.fillLineDataSet = fillLineDataSet
    }

    public func getFillLinePosition(dataSet: ILineChartDataSet, dataProvider: LineChartDataProvider) -> CGFloat {
        return 0.0
    }

    public func getFillLineDataSet() -> LineChartDataSet {
        return fillLineDataSet ?? LineChartDataSet()
    }

}
class CustomLineChartRenderer: LineChartRenderer {

    override open func drawLinearFill(context: CGContext, dataSet: ILineChartDataSet, trans: Transformer, bounds: XBounds) {
        guard let dataProvider = dataProvider else { return }

        let areaFillFormatter = dataSet.fillFormatter as? AreaFillFormatter

        let filled = generateFilledPath(
            dataSet: dataSet,
            fillMin: dataSet.fillFormatter?.getFillLinePosition(dataSet: dataSet, dataProvider: dataProvider) ?? 0.0,
            fillLineDataSet: areaFillFormatter?.getFillLineDataSet(),
            bounds: bounds,
            matrix: trans.valueToPixelMatrix)

        if dataSet.fill != nil
        {
            drawFilledPath(context: context, path: filled, fill: dataSet.fill!, fillAlpha: dataSet.fillAlpha)
        }
        else
        {
            drawFilledPath(context: context, path: filled, fillColor: dataSet.fillColor, fillAlpha: dataSet.fillAlpha)
        }
    }

    fileprivate func generateFilledPath(dataSet: ILineChartDataSet, fillMin: CGFloat, fillLineDataSet: ILineChartDataSet?, bounds: XBounds, matrix: CGAffineTransform) -> CGPath
    {
        let phaseY = animator?.phaseY ?? 1.0
        let isDrawSteppedEnabled = dataSet.mode == .stepped
        let matrix = matrix

        var e: ChartDataEntry!
        var fillLineE: ChartDataEntry?

        let filled = CGMutablePath()

        e = dataSet.entryForIndex(bounds.min)
        fillLineE = fillLineDataSet?.entryForIndex(bounds.min)

        if e != nil
        {
            if let fillLineE = fillLineE
            {
                filled.move(to: CGPoint(x: CGFloat(e.x), y: CGFloat(fillLineE.y * phaseY)), transform: matrix)
            }
            else
            {
                filled.move(to: CGPoint(x: CGFloat(e.x), y: fillMin), transform: matrix)
            }

            filled.addLine(to: CGPoint(x: CGFloat(e.x), y: CGFloat(e.y * phaseY)), transform: matrix)
        }

        // Create the path for the data set entries
        for x in stride(from: (bounds.min + 1), through: bounds.range + bounds.min, by: 1)
        {
            guard let e = dataSet.entryForIndex(x) else { continue }

            if isDrawSteppedEnabled
            {
                guard let ePrev = dataSet.entryForIndex(x-1) else { continue }
                filled.addLine(to: CGPoint(x: CGFloat(e.x), y: CGFloat(ePrev.y * phaseY)), transform: matrix)
            }

            filled.addLine(to: CGPoint(x: CGFloat(e.x), y: CGFloat(e.y * phaseY)), transform: matrix)
        }

        // Draw a path to the start of the fill line
        e = dataSet.entryForIndex(bounds.range + bounds.min)
        fillLineE = fillLineDataSet?.entryForIndex(bounds.range + bounds.min)
        if e != nil
        {
            if let fillLineE = fillLineE
            {
                filled.addLine(to: CGPoint(x: CGFloat(e.x), y: CGFloat(fillLineE.y * phaseY)), transform: matrix)
            }
            else
            {
                filled.addLine(to: CGPoint(x: CGFloat(e.x), y: fillMin), transform: matrix)
            }
        }

        // Draw the path for the fill line (backwards)
        if let fillLineDataSet = fillLineDataSet {
            for x in stride(from: (bounds.min + 1), through: bounds.range + bounds.min, by: 1).reversed()
            {
                guard let e = fillLineDataSet.entryForIndex(x) else { continue }

                if isDrawSteppedEnabled
                {
                    guard let ePrev = fillLineDataSet.entryForIndex(x-1) else { continue }
                    filled.addLine(to: CGPoint(x: CGFloat(e.x), y: CGFloat(ePrev.y * phaseY)), transform: matrix)
                }

                filled.addLine(to: CGPoint(x: CGFloat(e.x), y: CGFloat(e.y * phaseY)), transform: matrix)
            }
        }

        filled.closeSubpath()

        return filled
    }
}
 rob-k
on 15 Nov 2017
rob-k
on 15 Nov 2017
perfect example to mastering the project :)
liuxuan30
on 18 Nov 2017
how to resolve/ use this solution?
 jjy4880
on 5 Dec 2018
jjy4880
on 5 Dec 2018
@rob-k can you please provide usage example for this
 bhargavsejpalindianic
on 27 May 2019
bhargavsejpalindianic
on 27 May 2019
Sure, I use the code as follows:
let maxDataSet = LineChartDataSet()
let minDataSet = LineChartDataSet()

// ... fill the data sets

// Set the data
self.lineChart.data = LineChartData(dataSets: [maxDataSet, minDataSet])

// Set the custom line chart renderer
self.lineChart.renderer = CustomLineChartRenderer(dataProvider: self.lineChart, animator: self.lineChart.chartAnimator, viewPortHandler: self.lineChart.viewPortHandler)

maxDataSet.drawFilledEnabled = true
maxDataSet.fillFormatter = AreaFillFormatter(fillLineDataSet: minDataSet)
i installed this manually and followed each step as per example still looks like its not working @rob-k
bhargavsejpalindianic
on 28 May 2019
@rob-k i tried to debug using break points any of function from CustomLineChartRenderer not being called
bhargavsejpalindianic
on 28 May 2019
I updated my comment to include setting the LineChartRenderer.
rob-k
on 28 May 2019
still no luck man @rob-k
bhargavsejpalindianic
on 28 May 2019
If you want the color between ucbDataSet and lcbDataSet you need to pass the second data set to the formatter of the first one. You are passing the dataset to the formatter of itself. Try to do the following:
ucbDataSet.fillFormatter = AreaFillFormatter(fillLineDataSet: lcbDataSet)
(or the other way around)
rob-k
on 28 May 2019
already tried what i am trying to explain is
i tried to debug using break points any of function from CustomLineChartRenderer class not being called
bhargavsejpalindianic
on 28 May 2019
I see that you are using Bezier mode in your code:
lineChartDataSet.mode = .horizontalBezier
ucbDataSet.mode = .horizontalBezier
lcbDataSet.mode = .horizontalBezier
The code I provided only works for linear mode. You will have to change the mode to .linear or override drawHorizontalBezier and adjust the code accordingly.
rob-k
on 28 May 2019
@rob-k got it just worked thanks very much man for finding it out
bhargavsejpalindianic
on 28 May 2019
Would it be possible to implement this using CombinedChart ?
 michal-th
on 13 Oct 2019
michal-th
on 13 Oct 2019
Would it be possible to implement this using CombinedChart ?
did you find the solution ? the CombinedChart use the CombinedChartRender , not the LinearChartRender , so the call back is not called drawLinearFill , it use the default Render
the method drawLinearFill doesn't exist , it's take many of new renders when you search in the library
 Chakib-Temal
on 13 Dec 2019
Chakib-Temal
on 13 Dec 2019
Would it be possible to implement this using CombinedChart ?
solution combinedChart : https://github.com/PhilJay/MPAndroidChart/issues/338
Chakib-Temal
on 14 Dec 2019
Related issues
 kwstasna
·
3Comments
kwstasna
·
3Comments
 ahmedsafadii
·
3Comments
ahmedsafadii
·
3Comments
 JW00332
·
4Comments
JW00332
·
4Comments
 Bharati555
·
4Comments
Bharati555
·
4Comments
 cilasgimenez
·
4Comments
cilasgimenez
·
4Comments
Most helpful comment
I managed to achieve this by following @liuxuan30 's suggestions by subclassing
LineChartRendererand adding a variable to the class implementingIFillFormatter, which let's me pass a second data set as indicator for the fill line and draw the path accordingly (only for linear, but I assume you could do the same thing for Bezier).