Chartjs-plugin-datalabels: Display one label of the sum of stacked bars
Hi,
I have a horizontal stacked bar chart which looks like this:
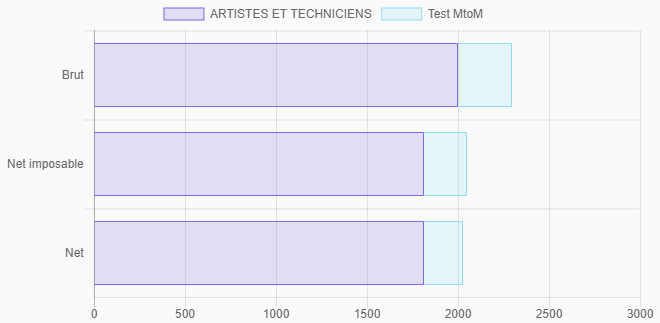
And I would like to display the sum of each stacked bar, like so:

I managed to get this result by returning an empty string for datasets that are not the last one (datasetIndex), and computing the sum for each bar (dataIndex):
plugins: {
    datalabels: {
        formatter: (value, ctx) => {
            let datasets = ctx.chart.data.datasets; // Tried `.filter(ds => !ds._meta.hidden);` without success
            if (ctx.datasetIndex === datasets.length - 1) {
                let sum = 0;
                datasets.map(dataset => {
                    sum += dataset.data[ctx.dataIndex];
                });
                return sum.toLocaleString(/* ... */);
            }
            else {
                return '';
            }

        },
        anchor: 'end',
        align: 'end'
    }
}
It works great, but if I toggle off one dataset (via the chart's legend), the result is less great:
if I toggle off the first dataset, I still have the sum of the two datasets as a label:

if I toggle off the last dataset, I don't have a label anymore:

As I commented in my code snippet, I tried to filter out the datasets with the _meta.hidden metadata, but it seems that the formatter function is not called again when toggleing datasets via the chart's legend.
Is there a better way to use datalabels with stacked bar charts? Or does anyone have an idea to make it work?
 LeoDupont
All 11 comments
Hi @LeoDupont. Can you build a jsfiddle (or similar) with your current chart config and data? It would help to investigate a solution.
formatter should be called when toggling dataset visiblity but _meta.hidden is private and actually doesn't describe the actual dataset visibility, you should use chart.isDatasetVisible(index) instead.
 simonbrunel
on 30 Nov 2017
simonbrunel
on 30 Nov 2017
Hello @simonbrunel, thank you for your answer.
I can confirm formatter is called when toggling dataset visibility (my bad).
Regarding _meta.hidden, I was also mistaken, the correct syntax being _meta[0].hidden (my bad, too).
I tried to use chart.isDatasetVisible(index) but it turned out ctx.dataset has no datasetIndex property, so I could not filter this way. Unless I missed that property?
So I chose to stick to _meta[0].hidden.
Finally, my condition if (ctx.datasetIndex === datasets.length - 1) could not work correctly because if I hide the first dataset, the last one has the index 1 whereas my datasets array is 1-item long, so its last index is 0...
Here is my final snippet, which works as intended:
plugins: {
datalabels: {
formatter: (value, ctx) => {
// Array of visible datasets :
let datasets = ctx.chart.data.datasets.filter(
ds => !ds._meta[0].hidden
// ds => ctx.chart.isDatasetVisible(ds.datasetIndex) // <-- does not work
);
// If this is the last visible dataset of the bar :
if (datasets.indexOf(ctx.dataset) === datasets.length - 1) {
let sum = 0;
datasets.map(dataset => {
sum += dataset.data[ctx.dataIndex];
});
return sum.toLocaleString(/* ... */);
}
else {
return '';
}
},
anchor: 'end',
align: 'end'
}
}
Its JSFiddle : https://jsfiddle.net/78ndvf2n/
I'm concerned about the _meta[0] though. Is _meta likely to have other sub-object than 0?
LeoDupont
on 30 Nov 2017
You should really not access _meta directly, that's very internal and have a special structure. If you want to access dataset metadata, you can use chart.getDatasetMeta(datasetIndex). I'm quite sure there is ctx.datasetIndex, if not that's a bug.
simonbrunel
on 30 Nov 2017
I think I would move the summation logic into a separated plugin responsible to compute the total for each "stack" and the utmost dataset index, the one for which you want to display the label. It would happen only one time, before the chart update (better for performances):
const totalizer = {
  id: 'totalizer',

  beforeUpdate: chart => {
    let totals = {}
    let utmost = 0

    chart.data.datasets.forEach((dataset, datasetIndex) => {
      if (chart.isDatasetVisible(datasetIndex)) {
        utmost = datasetIndex
        dataset.data.forEach((value, index) => {
          totals[index] = (totals[index] || 0) + value
        })
      }
    })

    chart.$totalizer = {
      totals: totals,
      utmost: utmost
    }
  }
}
Then you need to register this plugin to the charts you want to display the total:
new Chart('chart', {
  plugins: [totalizer],
  // ...
}
At this point, you can access computed information from chart.$totalizer and thus configure the datalabels plugin easily:
new Chart('chart', {
  plugins: [totalizer],
  options: {
    plugins: {
      datalabels: {
        formatter: (value, ctx) => {
          const total = ctx.chart.$totalizer.totals[ctx.dataIndex]
          return total.toLocaleString('fr-FR', {
            style: 'currency',
            currency: 'EUR'
          })
        },
        display: function(ctx) {
           return ctx.datasetIndex === ctx.chart.$totalizer.utmost
        }
      }
    }
  }
  // ...
}
Note that it's better to hide the other labels using the display option because nothing else will be computed for this label (e.g. the formatter will not be called for hidden labels).
Fiddle: https://jsfiddle.net/simonbrunel/9ezggxx5/
This example doesn't take in account all use cases, such as grouped stacks or negative values.
Edit: I didn't realize that you got a working solution before writing this comment.
simonbrunel
on 30 Nov 2017
I think your solution is much cleaner, so I opted for it. Thank you!
I won't use negative values nor grouped stacks for this project, but it may be a good plugin idea.
PS: I indeed have ctx.datasetIndex in the formatter, but I could not use it in my previous implementation (with a datasets.filter(/* ... */)).
LeoDupont
on 1 Dec 2017
Sounds good!
FYI, the array.filter callback takes extra arguments such as the index and the array itself. In your case you would have used index as the dataset index:
let datasets = ctx.chart.data.datasets.filter(
  (ds, datasetIndex) => ctx.chart.isDatasetVisible(datasetIndex)
)
Hi. I'm new to using Chart js and I wanted to ask how to put the total count of stacked bar chart at the top of each bar.
 ShafighBahamin
on 26 Jun 2018
ShafighBahamin
on 26 Jun 2018
Try this for toggle dataset
plugins: {
datalabels: {
formatter: (value, ctx) => {
if (ctx.datasetIndex == 0)
return value + "%";
else
return "";
},
anchor: 'end',
align: 'end'
}
}
 shgithu6
on 30 Aug 2018
shgithu6
on 30 Aug 2018
I already figured it out but thanks still!
ShafighBahamin
on 31 Aug 2018
I know this is an old topic, but I modified Simon's plugin to be usable for grouped stacks. Hope this helps anyone.
const totalizer = {
            id: 'totalizer',
            beforeUpdate: function (chart) {
                var totals = [];
                var utmost = {};
                chart.data.datasets.forEach(function (dataset, datasetIndex) {
                    if (chart.isDatasetVisible(datasetIndex)) {
                        var stack = dataset.stack;
                        utmost[stack] = datasetIndex;
                        dataset.data.forEach(function (value, index) {
                            if (totals[index] === undefined) {
                                totals[index] = {};
                            }
                            totals[index][stack] = (totals[index][stack] || 0) + value;
                        })
                    }
                });
                chart.$totalizer = {
                    totals: totals,
                    utmost: utmost
                }
            }
        }
The totals are then callable by using chart.$totalizer.totals[dataIndex][stack] and the utmost items are callable by using chart.$totalizer.utmost[stack]
 michvllni
on 14 Jan 2019
michvllni
on 14 Jan 2019
Thanks a lot @michvllni , This helped a lot. Don't forget to use dataIndex and stack as ctx.dataIndex and ctx.stack if u end up in errors.
 midhun-qburst
on 18 Jan 2019
midhun-qburst
on 18 Jan 2019
Related issues
 danielwstrimpel
·
4Comments
danielwstrimpel
·
4Comments
 boriskogan81
·
4Comments
boriskogan81
·
4Comments
 jedskie
·
6Comments
jedskie
·
6Comments
 sidv93
·
3Comments
sidv93
·
3Comments
 pjc2007
·
26Comments
pjc2007
·
26Comments
Most helpful comment
I think I would move the summation logic into a separated plugin responsible to compute the total for each "stack" and the utmost dataset index, the one for which you want to display the label. It would happen only one time, before the chart update (better for performances):
Then you need to register this plugin to the charts you want to display the total:
At this point, you can access computed information from
chart.$totalizerand thus configure the datalabels plugin easily:Note that it's better to hide the other labels using the
displayoption because nothing else will be computed for this label (e.g. theformatterwill not be called for hidden labels).Fiddle: https://jsfiddle.net/simonbrunel/9ezggxx5/
This example doesn't take in account all use cases, such as grouped stacks or negative values.