Dears,
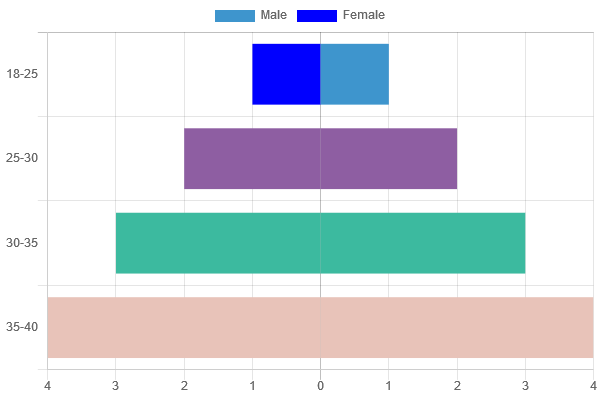
Please help me to create a horizontal population chart, I tried to create one but it is showing me - [Negative] and + [Positive]
Where as I want to show the graph as one side Male and other side Female value.
Appreciate help and support.
https://user-images.githubusercontent.com/91035/92748341-b6246c00-f38d-11ea-8029-2068f64259ce.png
Please find the script I am using,
 AnilChitatil
All 2 comments
@AnilChitatil I don't know if this is what you would like to have but you can use ticks callback in order to have absolute ticks values on scale.
      xAxes: [{
           ticks: {
               callback: function(value, index, values) {
                     return Math.abs(value);
                }
           }
      }]
See here CodePen: https://codepen.io/stockinail/pen/gOrKXYY
 stockiNail
on 14 Sep 2020
stockiNail
on 14 Sep 2020
👍2
❤1
Thanks @stockiNail. I think that is the best way to achieve this
 etimberg
on 14 Sep 2020
etimberg
on 14 Sep 2020
Was this page helpful?
0 / 5 - 0 ratings
Related issues
 bytesnz
·
3Comments
bytesnz
·
3Comments
 longboy
·
3Comments
longboy
·
3Comments
 SylarRuby
·
3Comments
SylarRuby
·
3Comments
"Cannot read property 'length' of undefined" when using bars on time series without 'labels' defined
 kennsippell
·
3Comments
kennsippell
·
3Comments
 frlinw
·
3Comments
frlinw
·
3Comments
Most helpful comment
@AnilChitatil I don't know if this is what you would like to have but you can use ticks callback in order to have absolute ticks values on scale.
See here CodePen: https://codepen.io/stockinail/pen/gOrKXYY