Simple question - I have data from backend, why the hell on earth I must specify the colors for the charts?
Can there be some default colors if you don't provide color & highlight color ?
 vladshcherbin
All 34 comments
I subscribe to this issue. Charts should be able to pick random colors by themselves, unless the user specifies his own colors. Currently we have to specify colors for each set of data, which is very hard when a variable number of data sets is displayed.
I would really love & need this feature.
By the way, thanks for the great work.
 zmirc
on 12 Dec 2014
zmirc
on 12 Dec 2014
If you use angular, you should try angular-chart.js, it does exactly that,
among other things.
On 12/12/2014 7:04 PM, "Mircea" [email protected] wrote:
I subscribe to this issue. Charts should be able to pick random colors by
themselves, unless the user specifies his own colors. Currently we have to
specify colors for each set of data, which is very hard when a variable
number of data sets is displayed.
I would really love & need this feature.
By the way, thanks for the great work.—
Reply to this email directly or view it on GitHub
https://github.com/nnnick/Chart.js/issues/815#issuecomment-66742709.
 jtblin
on 12 Dec 2014
jtblin
on 12 Dec 2014
Beside that I consider it bad style to use "why the hell on earth" when asking a humble question, you could have a look at d3 to get some color arrrays to choose from: https://github.com/mbostock/d3/wiki/Ordinal-Scales#categorical-colors
 saintedlama
on 12 Dec 2014
saintedlama
on 12 Dec 2014
@saintedlama yeah, although the chart.js looks cool, I had to move to another library. The author does not respond to users, 300+ issues, 99+ pr, this project is pretty much dead. But, it still looks nice.
vladshcherbin
on 13 Dec 2014
@VladShcherbin #795 has a link to a more active version. I'm not sure how compatible it is.
 etimberg
on 13 Dec 2014
etimberg
on 13 Dec 2014
Sorry for the slow reply.
This project has new life breathing in. I am prioritizing this issue.
 fulldecent
on 19 Jan 2015
fulldecent
on 19 Jan 2015
maybe this helps, i've written like this:
fix core Chart.Type function:
    Chart.Type = function(data,options,chart){
        this.options = options;
        this.chart = chart;
        this.id = uid();
        //Add the chart instance to the global namespace
        Chart.instances[this.id] = this;
        //fix colors
        if (Chart.defaults.global.colours) {
            helpers.each(data.datasets, function (dataset, index) {
                if ((dataset.fillColor === undefined) && (dataset.strokeColor === undefined)) {
                    helpers.extend(dataset, Chart.defaults.global.colours[index % Chart.defaults.global.colours.length]);
                }
            });
        }
        // Initialize is always called when a chart type is created
        // By default it is a no op, but it should be extended
        if (options.responsive){
            this.resize();
        }
        this.initialize.call(this,data);
    };
and define colors based on angular
Chart.defaults.global.colours = [
    { // blue
        fillColor: "rgba(151,187,205,0.2)",
        strokeColor: "rgba(151,187,205,1)",
        pointColor: "rgba(151,187,205,1)",
        pointStrokeColor: "#fff",
        pointHighlightFill: "#fff",
        pointHighlightStroke: "rgba(151,187,205,0.8)"
    },
    { // light grey
        fillColor: "rgba(220,220,220,0.2)",
        strokeColor: "rgba(220,220,220,1)",
        pointColor: "rgba(220,220,220,1)",
        pointStrokeColor: "#fff",
        pointHighlightFill: "#fff",
        pointHighlightStroke: "rgba(220,220,220,0.8)"
    },
    { // red
        fillColor: "rgba(247,70,74,0.2)",
        strokeColor: "rgba(247,70,74,1)",
        pointColor: "rgba(247,70,74,1)",
        pointStrokeColor: "#fff",
        pointHighlightFill: "#fff",
        pointHighlightStroke: "rgba(247,70,74,0.8)"
    },
    { // green
        fillColor: "rgba(70,191,189,0.2)",
        strokeColor: "rgba(70,191,189,1)",
        pointColor: "rgba(70,191,189,1)",
        pointStrokeColor: "#fff",
        pointHighlightFill: "#fff",
        pointHighlightStroke: "rgba(70,191,189,0.8)"
    },
    { // yellow
        fillColor: "rgba(253,180,92,0.2)",
        strokeColor: "rgba(253,180,92,1)",
        pointColor: "rgba(253,180,92,1)",
        pointStrokeColor: "#fff",
        pointHighlightFill: "#fff",
        pointHighlightStroke: "rgba(253,180,92,0.8)"
    },
    { // grey
        fillColor: "rgba(148,159,177,0.2)",
        strokeColor: "rgba(148,159,177,1)",
        pointColor: "rgba(148,159,177,1)",
        pointStrokeColor: "#fff",
        pointHighlightFill: "#fff",
        pointHighlightStroke: "rgba(148,159,177,0.8)"
    },
    { // dark grey
        fillColor: "rgba(77,83,96,0.2)",
        strokeColor: "rgba(77,83,96,1)",
        pointColor: "rgba(77,83,96,1)",
        pointStrokeColor: "#fff",
        pointHighlightFill: "#fff",
        pointHighlightStroke: "rgba(77,83,96,1)"
    }
];
 dany28
on 21 Jan 2015
dany28
on 21 Jan 2015
Please take a look at https://github.com/nnnick/Chart.js/pull/711
I prefer calculated colors instead of a long list of predefined colors.
 pitgrap
on 26 Jan 2015
pitgrap
on 26 Jan 2015
As per #711 I'm going to close this for now, as it would seem #711 is going to be merged soon
 jakesyl
on 26 Jan 2015
jakesyl
on 26 Jan 2015
I don't believe merging #711 has fixed this; doesn't it only generate colors for a doughnut chart? I'd love not to manually specify colors for line chart as well (and probably others, too).
 kzemek
on 14 Aug 2015
kzemek
on 14 Aug 2015
I second @kzemek comment - #711 seem to focus only on pie charts. It would be good if colours were defined as in a way that one didn't have to merge the data with presentation.
Ideally one have a style set for a given project - such that charts get a consistent styling from a single central location.
@dany28 's comment sounded interesting. Perhaps it can be considered for a PR?
 thomthom
on 7 May 2016
thomthom
on 7 May 2016
Hey folks, was there ever resolution on how to properly do this?
 rathboma
on 22 Nov 2016
rathboma
on 22 Nov 2016
+1
 connect-technologies
on 25 Nov 2016
connect-technologies
on 25 Nov 2016
My solution is doing looping in backgroundColor's parameter with the value = randomColor(). This function from https://github.com/davidmerfield/randomColor, so you need to include the randomColor js
 mdd1704
on 29 Nov 2016
mdd1704
on 29 Nov 2016
@mdd1704 would be cool to be able to get both background and hoverBackground color using that lib... https://github.com/davidmerfield/randomColor/issues/73
 micheledallatorre
on 29 Nov 2016
micheledallatorre
on 29 Nov 2016
I'm not sure why this issue was closed as I ran into this problem today. I found the top 20 default google charts colors pretty helpful.
var default_colors = ['#3366CC','#DC3912','#FF9900','#109618','#990099','#3B3EAC','#0099C6','#DD4477','#66AA00','#B82E2E','#316395','#994499','#22AA99','#AAAA11','#6633CC','#E67300','#8B0707','#329262','#5574A6','#3B3EAC']
 andr3w321
on 3 Jan 2017
andr3w321
on 3 Jan 2017
I've been manually mapping color data on to raw data records:
    const colors = {
        backgroundColor: [
            'rgba(255, 99, 132, 0.2)',
            'rgba(54, 162, 235, 0.2)',
            'rgba(255, 206, 86, 0.2)',
            'rgba(75, 192, 192, 0.2)',
            'rgba(153, 102, 255, 0.2)',
            'rgba(255, 159, 64, 0.2)'
        ],
        borderColor: [
            'rgba(255,99,132,1)',
            'rgba(54, 162, 235, 1)',
            'rgba(255, 206, 86, 1)',
            'rgba(75, 192, 192, 1)',
            'rgba(153, 102, 255, 1)',
            'rgba(255, 159, 64, 1)'
        ],
        borderWidth: 1,
    };

    const data = {
        ...serverData,
        datasets: mapValues(serverData.datasets, dataset => ({ ...dataset, ...colors }))
    };
Where "serverData" looks like:
    "data": {
        "labels": ["Cows", "Sheep", "Pigs"],
        "datasets": [
            {
                "data": [55, 40, 30]
            }
        ]
    }
Then pass "data" in to the chart. It's not perfect, but at least my input data doesn't need to be filled with color/display data.
 cjke
on 4 Jan 2017
cjke
on 4 Jan 2017
@cjke can you please better show in your code how const data is exactly defined? E.g. what does mapValues() do and so on.
Thanks!
micheledallatorre
on 10 Jan 2017
Thats pretty much it. The whole data object is passed into the Charts data attribute. I'm using React, so might look a tad different, but something like:
<Bar data={data} options={options} />
MapValues is simply doing a big join, basically grabbing a bit of color to mix with the data.
If it's not working for you, maybe pose it as a question on stackoverflow (and dump the link here)
cjke
on 10 Jan 2017
It is easy:
          var config = {
                    type: 'pie',
                    data: {
                        datasets:[{
                            data: ##,
                            backgroundColor: poolColors(total),
                            label: ##
                        }],
                        labels: data.labels
                    },
                    options: {
                        responsive: true
                    }
                };

    var poolColors = function (a) {
        var pool = [];
        for(i=0;i<a;i++){
            pool.push(dynamicColors());
        }
        return pool;
    }

    var dynamicColors = function() {
        var r = Math.floor(Math.random() * 255);
        var g = Math.floor(Math.random() * 255);
        var b = Math.floor(Math.random() * 255);
        return "rgb(" + r + "," + g + "," + b + ")";
    }
 rikardocorp
on 18 Jan 2017
rikardocorp
on 18 Jan 2017
A chart library like this should definitely provide colors by default, that can be overridden if needed. The colors used for the docs would be a good start.
I've created a colorScale function that implements d3's 20 part color scale. Slightly more predictable than using a random number. Then implement in a similar way to @rikardocorp above.
import { schemeCategory20c as c20 } from 'd3-scale';

...

colorScale(i) {
    return c20[i % 20];
}
 lsei
on 7 Mar 2017
lsei
on 7 Mar 2017
"why the hell on earth" is this issue closed?
In latest version it's still not fixed.
 khuongduybui
on 7 Mar 2017
khuongduybui
on 7 Mar 2017
All the ideas of random color generator are bad, for your users it will generate random colors every time - pretty bad idea on ui consistency.
 amitmawkin
on 25 Mar 2017
amitmawkin
on 25 Mar 2017
I think the majority of the solutions in here, bar a few, are about setting default colors based on a nice predetermined collection of colors. Rather than truely being random, and I agree, true random would be madness - "lime on yellow anyone?" 🍋
cjke
on 25 Mar 2017
Then pass "data" in to the chart. It's not perfect, but at least my input data doesn't need to be filled with color/display data.
Any news on this? Doesn't feel right putting the color settings in with my actual data.
https://stackoverflow.com/questions/17155072/default-visual-style-in-chart-js-bar-chart
 frankie-loves-jesus
on 6 Jun 2017
frankie-loves-jesus
on 6 Jun 2017
@etimberg isn't there a way to define the chart color globally? Ie. like I'm already doing with my fonts:
// Chart.defaults.global.backgroundColor: "#000";
Chart.defaults.global.defaultFontFamily = "'Comic Sans MS'";
Chart.defaults.global.defaultFontSize = 11;
cc @VladShcherbin
frankie-loves-jesus
on 7 Jun 2017
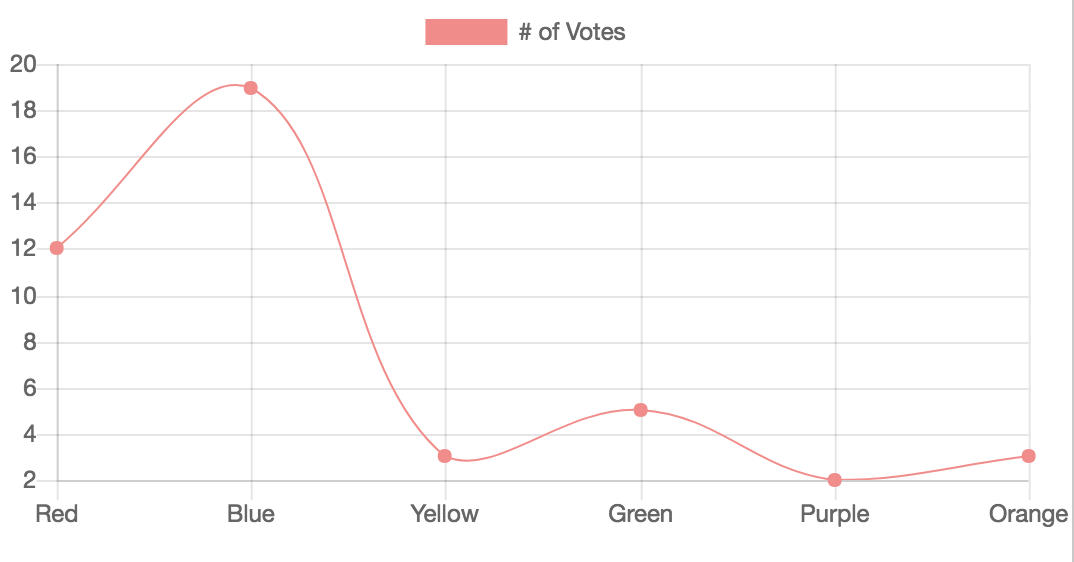
Other than using a function to generate random color as indicated by @rikardocorp, you can also use some beautiful palettes from designers. For example, https://github.com/Jam3/nice-color-palettes provides a nice collection of awesome palettees. All you need to do is to install
npm install nice-color-palettes --save-dev
and just use it.
import colors from 'nice-color-palettes'

var ctx = document.getElementById("myChart").getContext('2d');
var myChart = new Chart(ctx, {
    type: 'bar',
    data: {
        labels: ["Red", "Blue", "Yellow", "Green", "Purple", "Orange"],
        datasets: [{
            label: '# of Votes',
            data: [12, 19, 3, 5, 2, 3],
            backgroundColor: colors[0].concat(colors[1]),
            borderWidth: 1
        }]
    },
    options: {
        scales: {
            yAxes: [{
                ticks: {
                    beginAtZero:true
                }
            }]
        }
    }
});
if you are not using webpack, you can always download the 100.json from nice-color-palettes repo and then just use it in your javascript.
 vwxyzjn
on 28 Jun 2017
vwxyzjn
on 28 Jun 2017
+1, this is a very basic feature and should be added. Random colors is not a good idea (you can get very similar ones and make the chart confusing), having a way to set a list of colors by default for all kind of charts is what is needed, @saintedlama mentioned a lot of PR are pending (it's 28 at this time), I guess no one made a change to handle this, maybe we should try? I'm gonna try it.
 tavuntu
on 8 Sep 2017
tavuntu
on 8 Sep 2017
@etimberg mentioned here that this will not be implemented in the core. However, he does mention creating a plugin that utilizes the beforeUpdate hook.
On a different note, what is with this section of the docs, and how is it used? I haven't seen any examples of it being used.
 alex-martinez
on 11 Oct 2017
alex-martinez
on 11 Oct 2017

As @alex-martinez noted @etimberg 's mention in #1618,
here is a dirty snippet using global plugin technique:
import Color from 'color';
import palette from 'json-loader!open-color/open-color.json';

const colors = [
  palette['red'],
  palette['blue'],
  palette['yellow'],
  palette['green'],
  palette['pink'],
  palette['cyan'],
  palette['orange'],
  palette['lime'],
  palette['grape'],
  palette['indigo'],
  palette['teal'],
  palette['violet'],
];

function pickColor(idx: number) {
  return colors[idx % colors.length][4 - Math.floor(idx / colors.length)];
}

Chart.pluginService.register({
  beforeUpdate(chart) {
    switch (chart.config.type) {
      case 'bar': {
        let idx = 0;
        for (const dataset of chart.data.datasets) {
          if (!dataset.borderColor) {
            const borderColor = [];
            for (const _d of dataset.data) {
              borderColor.push(pickColor(idx++));
            }
            dataset.borderColor = borderColor;

            if (!dataset.backgroundColor) {
              dataset.backgroundColor = borderColor.map(hex => {
                const color = new Color(hex).alpha(0.5);
                return color.string();
              });
            }
          }
        }
        break;
      }
      case 'line': {
        let idx = 0;
        for (const dataset of chart.data.datasets) {
          if (!dataset.borderColor) {
            dataset.borderColor = pickColor(idx++);
            if (!dataset.backgroundColor) {
              dataset.backgroundColor = dataset.borderColor;
            }
          }
        }
        break;
      }
    }
  },
});
I am new to Chart.js and the code might have some flaws :)
 pawsong
on 15 Oct 2017
pawsong
on 15 Oct 2017
What about integrating http://google.github.io/palette.js/ to generate default colors?
 pumpadump
on 30 Jan 2018
pumpadump
on 30 Jan 2018
@pawsong your code is just what I was looking for!
btw:

interesting...
tavuntu
on 30 Jan 2018
I just released chartjs-plugin-colorschemes that enables automatic coloring using predefined color schemes. GitHub repository is here.
 nagix
on 5 Nov 2018
nagix
on 5 Nov 2018
😮😮 Amazed to see this issue closed when it is such a basic and easy thing to add to the library.
 alvarotrigo
on 27 Mar 2019
alvarotrigo
on 27 Mar 2019
Related issues
 bytesnz
·
3Comments
bytesnz
·
3Comments
 srijitcoder
·
3Comments
srijitcoder
·
3Comments
 kennsippell
·
3Comments
kennsippell
·
3Comments
 adriantombu
·
3Comments
adriantombu
·
3Comments
 longboy
·
3Comments
longboy
·
3Comments
Most helpful comment
"why the hell on earth" is this issue closed?
In latest version it's still not fixed.