Chart.js: setLineDash isn't working for bar borders in 2.8
I'm trying to make dashed borders for the bar chart, but having trouble with 2.8. I've found code online that has working examples for 2.1: http://jsfiddle.net/Ls8u10dp/ but the same thing doesn't work with 2.8: http://jsfiddle.net/L7ubzshc/
Is there any way around this?
Thanks
 perkalerk
All 6 comments
@perkalerk border dash is not currently available for BAR chart. Maybe you could ask for an enhancement or prepare a PR.
In version 2.9.2, as far as I have seen, the elements are changed into ES6 objects and therefore the examples does not work anymore. But let me say I'm not really a JS developer and maybe someone else can find another workaround.
But waiting for enhancement, you can use a plugin to do what you need.
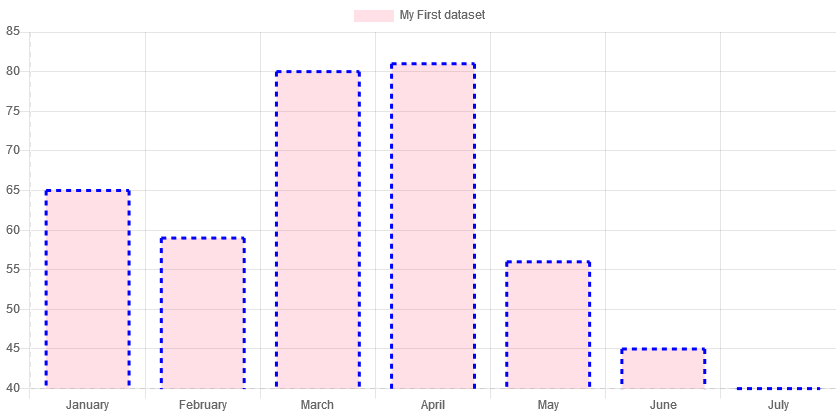
I've prepared an example (you should extend it if you have other requiremets) and it should work (tested in your jsfiddle link).
Here you can see the whole Javascript part:
var config = {
type: 'bar',
data: {
labels: ["January", "February", "March", "April", "May", "June", "July"],
datasets: [{
label: "My First dataset",
backgroundColor: "rgba(255,99,132,0.2)",
data: [65, 59, 80, 81, 56, 45, 40],
borderColor: 'blue',
borderWidth: 0,
}]
},
plugins: [{
afterDatasetDraw: function(chart, args, options) {
args.meta.data.forEach(function(element) {
var borderWidth = 3;
var ctx = chart.ctx;
var vm = element._view;
var half = vm.width / 2;
var left = vm.x - half;
var right = vm.x + half;
var top = vm.y;
var width = right - left;
var height = chart.chartArea.bottom - top + (borderWidth / 2) - 1;
ctx.beginPath();
ctx.lineWidth = borderWidth;
ctx.strokeStyle = vm.borderColor;
ctx.setLineDash([5, 5]);
ctx.moveTo(left, top);
ctx.lineTo(left, top + height);
ctx.moveTo(left, top);
ctx.lineTo(left + width, top);
ctx.moveTo(left + width, top);
ctx.lineTo(left + width, top + height);
ctx.stroke();
ctx.save();
});
}
}]
};
var ctx = document.getElementById("myChart").getContext("2d");
myChart = new Chart(ctx, config);
A couple of point to pay attention:
- in chart options set
borderWidth: 0,and set your border width by plugin - The legend does not reflect the border width and dash you set. Maybe by legend label callback you can fix it.
Again, just a workaround taht does not address all cases.
Apologize if my javascript code is not good!
 stockiNail
on 8 Nov 2019
stockiNail
on 8 Nov 2019
In version 2.9.2, as far as I have seen, the elements are changed into ES6 objects
That's only in 3.0 (yet to be released)
 benmccann
on 8 Nov 2019
benmccann
on 8 Nov 2019
@benmccann sorry my fault. I was convinced to be written as comment.
stockiNail
on 8 Nov 2019
@perkalerk about why the online code does not work anymore in version 2.8, in this version the Rectangle is drawn without using any line (or stroke) therefore the setLineDash context method does not effect on the the rectangle.
stockiNail
on 12 Nov 2019
@perkalerk border dash is not currently available for BAR chart. Maybe you could ask for an enhancement or prepare a PR.
In version 2.9.2, as far as I have seen, the elements are changed into ES6 objects and therefore the examples does not work anymore. But let me say I'm not really a JS developer and maybe someone else can find another workaround.
But waiting for enhancement, you can use a plugin to do what you need.
I've prepared an example (you should extend it if you have other requiremets) and it should work (tested in your jsfiddle link).
Here you can see the whole Javascript part:var config = { type: 'bar', data: { labels: ["January", "February", "March", "April", "May", "June", "July"], datasets: [{ label: "My First dataset", backgroundColor: "rgba(255,99,132,0.2)", data: [65, 59, 80, 81, 56, 45, 40], borderColor: 'blue', borderWidth: 0, }] }, plugins: [{ afterDatasetDraw: function(chart, args, options) { args.meta.data.forEach(function(element) { var borderWidth = 3; var ctx = chart.ctx; var vm = element._view; var half = vm.width / 2; var left = vm.x - half; var right = vm.x + half; var top = vm.y; var width = right - left; var height = chart.chartArea.bottom - top + (borderWidth / 2) - 1; ctx.beginPath(); ctx.lineWidth = borderWidth; ctx.strokeStyle = vm.borderColor; ctx.setLineDash([5, 5]); ctx.moveTo(left, top); ctx.lineTo(left, top + height); ctx.moveTo(left, top); ctx.lineTo(left + width, top); ctx.moveTo(left + width, top); ctx.lineTo(left + width, top + height); ctx.stroke(); ctx.save(); }); } }] }; var ctx = document.getElementById("myChart").getContext("2d"); myChart = new Chart(ctx, config);
A couple of point to pay attention:
- in chart options set
borderWidth: 0,and set your border width by plugin- The legend does not reflect the border width and dash you set. Maybe by legend label callback you can fix it.
Again, just a workaround taht does not address all cases.
Apologize if my javascript code is not good!
Hi,
Your code Is good and working with latest version for bar chart.
do you have code for horizontal bar chart ?
 bhaveshpatel200
on 11 Jan 2020
bhaveshpatel200
on 11 Jan 2020
Hi,
below code is working for 'Horizontal Bar'.
var config = {
  type: 'horizontalBar',
  scales:{
  xAxes:[{position : 'top', ticks: {beginAtZero: true, min: 10}}],
  yAxes:[{}]
  },
  data: {
    labels: ["January", "February", "March", "April", "May", "June", "July"],
    datasets: [{
      label: "My First dataset",
      backgroundColor: "rgba(255,99,132,0.2)",
      data: [65, 59, 80, 81, 56, 45, 40],
      borderColor: 'blue',
      borderWidth: 0,
    }]
  },
  plugins: [{
   afterDatasetDraw: function(chart, args, options) {
      args.meta.data.forEach(function(element) {
        var borderWidth = 3;
        var ctx = chart.ctx;
        var vm = element._view;

        var half = vm.height / 2;
        var top = vm.y - half;
        var bottom = vm.y + half;
        var right = vm.x;
        var left = chart.chartArea.left;

        ctx.beginPath();
        ctx.lineWidth = borderWidth;
        ctx.strokeStyle = vm.borderColor;
        ctx.setLineDash([6, 6]);

        ctx.moveTo(left, top);
        ctx.lineTo(right, top);
        ctx.moveTo(right, top);
        ctx.lineTo(right, bottom);
        ctx.moveTo(right, bottom);
        ctx.lineTo(left, bottom);

        ctx.stroke();
        ctx.save();
    });
    }
  }]
};

var ctx = document.getElementById("myChart").getContext("2d");
myChart = new Chart(ctx, config);
Related issues
 adriantombu
·
3Comments
adriantombu
·
3Comments
 JAIOMP
·
3Comments
JAIOMP
·
3Comments
 HeinPauwelyn
·
3Comments
HeinPauwelyn
·
3Comments
 nickgoodliff
·
3Comments
nickgoodliff
·
3Comments
 frlinw
·
3Comments
frlinw
·
3Comments
Most helpful comment
Hi,
below code is working for 'Horizontal Bar'.