Chart.js: Tool tip is cut off on rightmost point
When using tooltips, the right most point's tooltip seems to be cut off. It seems as if it is out of bounds of the actual canvas.

 joeljeske
All 77 comments
I'm also having this issue
 tasl33m
on 21 Sep 2014
tasl33m
on 21 Sep 2014
+1 also having this issue
 fhinson
on 28 Sep 2014
fhinson
on 28 Sep 2014
Here's a JSBin that recreates the issue: http://jsbin.com/yebadi/1/edit
 etimberg
on 1 Oct 2014
etimberg
on 1 Oct 2014
+1 Same issue here.
 brettmhoffman
on 2 Oct 2014
brettmhoffman
on 2 Oct 2014
+1 but for both sides since I disabled the scale.
 haydenbleasel
on 16 Oct 2014
haydenbleasel
on 16 Oct 2014
any progress?
 maeishoj
on 12 Nov 2014
maeishoj
on 12 Nov 2014
Also having this issue with my pie chart.

 xierox
on 4 Dec 2014
xierox
on 4 Dec 2014
Same issue for me, but if you have a bit of a larger circle for your data points, the last data point's circle on the right side gets cut off too. I imagine it would have the same issue with the first data point if the scale is disabled on the left side as haydenbleasel mentioned above.
 mindjuice
on 13 Jan 2015
mindjuice
on 13 Jan 2015
+1 for me as well with bar charts. The tool tip gets cut off on both the left and right edge depending on how long the content of it is.
 jenswegar
on 2 Feb 2015
jenswegar
on 2 Feb 2015
I'm sure that this is due to the fact that the tooltips are generated within the confines of the canvas, making it difficult to fix.
I had the same issue on my doughnut chart and solved it by implementing custom tooltips as per the example on the samples folder - worked in conjunction with my existing tooltip fontsize and template settings in the chart initialisation code:
var myDoughnutChart = new Chart(donut).Doughnut(donutdata, {
tooltipFontSize: 10,
tooltipTemplate: "<%if (label){%><%=label%>: <%}%><%= value %>hrs",
percentageInnerCutout : 70
});
Check out samples/pie-customTooltips.html for the custom tooltip code. Copy/paste and it worked straight away. Very happy!
Tooltip displayed well outside the bounds of the canvas:

PS: there's a line chart example too, which I'm guessing will work fine with bar charts.
 robertturrall
on 2 Feb 2015
robertturrall
on 2 Feb 2015
+1
 idangozlan
on 15 Feb 2015
idangozlan
on 15 Feb 2015
+1
 akubos
on 17 Feb 2015
akubos
on 17 Feb 2015
+1 quite annoying :-)
 fjarrett
on 24 Mar 2015
fjarrett
on 24 Mar 2015
Take a look at http://www.chartjs.org/docs/#advanced-usage-external-tooltips
 tannerlinsley
on 24 Mar 2015
tannerlinsley
on 24 Mar 2015
See my StackOverflow post for a workaround for this that involves simply adding spaces to the leftmost or rightmost label. Not 100% perfect for everyone's use cases, but works great for many cases.
mindjuice
on 19 Apr 2015
For line charts, I solve the issue with the right-most tooltip being cut off only when the chart was thin (labels show slanted, the last point on the right was right against the right of the canvas) by adding more padding to the left/right via the option ",tooltipXPadding: 15" - since the tooltip on the right was generally positioned correct, just a tad cut off, this ensured the data was always visible since there is now enough padding to keep it within the canvas. I accept visually that now all tooltips now have a lot of padding on the sides and the last on the right trimmed (cannot see the rounded right side).
 terraelise
on 24 Apr 2015
terraelise
on 24 Apr 2015
@terraelise If you follow my suggestion above, you don't have to live with the rounded corners getting cut off or unnecessary tooltip padding either.
mindjuice
on 24 Apr 2015
+1 it looks like #1064 fixes this too.
 DavidVII
on 4 May 2015
DavidVII
on 4 May 2015
@joeljeske Huzzah! The first alpha of Chart.js 2.0 has landed and should fix this issue. Check out the release and try it out! We've got a lot of momentum right now, so please help us test so we can launch 2.0 Gold by the end of the month.
https://github.com/nnnick/Chart.js/releases/tag/v2.0-alpha
I'm closing this issue for now, but if you have implementation questions or find bugs, please create a jsfiddle and post the link here and we'll reopen this issue and get it fixed.
 derekperkins
on 4 Jun 2015
derekperkins
on 4 Jun 2015
Interestingly, by setting the "tooltipCaretSize" option to "0" solves the issue
{ tooltipCaretSize: 0, ... }
 akocmark
on 28 Dec 2015
akocmark
on 28 Dec 2015
Thank you Akocmark, this was super easy solution! It worked right away :)
 dessita
on 12 Jan 2016
dessita
on 12 Jan 2016
@dessita glad I'm able to help :)
akocmark
on 13 Jan 2016
Am I the only one having the problem where the tooltip being passed into the global function is always false? Am I doing something wrong?
// !tooltip is always false?
if (!tooltip) {
    tooltipEl.css({
        opacity: 0
    });
    return;
}
 akousmata
on 1 Feb 2016
akousmata
on 1 Feb 2016
Ok, sorry about this. I realized I didn't have an empty div on the page just for the tooltip #chartjs-tooltip rather crucial div I suppose.
akousmata
on 1 Feb 2016
+1
 daviddunne
on 9 Feb 2016
daviddunne
on 9 Feb 2016
Thank you @akocmark. Nice and simple solution :+1:
 LuisPalomo
on 25 Feb 2016
LuisPalomo
on 25 Feb 2016
@LuisPalomo no worries bruh
akocmark
on 25 Feb 2016
+1
 PixelAtLarge
on 8 Apr 2016
PixelAtLarge
on 8 Apr 2016
+10 @akocmark , perfect solution.
 barintsights
on 21 Jul 2016
barintsights
on 21 Jul 2016
@akocmark solution worked excellent for line charts in v1, but not pie charts for me sadly :(
 rohan-deshpande
on 1 Sep 2016
rohan-deshpande
on 1 Sep 2016
can confirm. this solution is not working in v2
 apfz
on 21 Sep 2016
apfz
on 21 Sep 2016
For those interested I've been having the same problem on the most recent version (2.3). To solve the issue I modified the code found here to suit my needs. I'm using a doughnut chart in the example below but should work for every type of chart.
<!doctype html>
<html>

<head>
    <title>Pie Chart with Custom Tooltips</title>
    <script src="../dist/Chart.bundle.js"></script>
    <script src="http://cdnjs.cloudflare.com/ajax/libs/jquery/2.1.3/jquery.min.js"></script>

    <style>
    #chartjs-tooltip {
      opacity: 1;
      position: absolute;
      background: rgba(0, 0, 0, .7);
      color: white;
      border-radius: 3px;
      -webkit-transition: all .1s ease;
      transition: all .1s ease;
      pointer-events: none;
      -webkit-transform: translate(-50%, 0);
      transform: translate(-50%, 0);
    }
    </style>
</head>

<body>
  <div id="parent-div"
    <canvas id="chart-area2" width="300" height="300" />
    <div id="chartjs-tooltip"></div>
  </div>

  <script>
    var ctx = document.getElementById("chart-area2").getContext("2d");
    var data = {
      labels: ["First label", "Second Label"],
      datasets: [
        {
          data: [[1,2,3,4,5], [6,7,8,9,10],
          backgroundColor: ['#3e569d', '#146816']
        },
      ]
    };
    var options = {
      tooltips: {
        enabled: false,
        custom: function(tooltip) {
          // Tooltip Element
          var tooltipEl = $('#chartjs-tooltip');
          // Have the tooltip appear/disappear when you hover on/off the chart
          $("#parent-div).mouseover(function(e) {
            tooltipEl.css('visibility', 'visible');
          });
          $("#parent-div).mouseleave(function(e) {
            tooltipEl.css('visibility', 'hidden');
          });
          // Set Text
          if (tooltip.body) {
            var innerHtml = [
              (tooltip.body[0].lines || []).join('\n')
            ];
            tooltipEl.html(innerHtml.join('\n').replace(/,/g, ', '));
          }
          // Find Y Location on page
          var top = 0;
          if (tooltip.yAlign) {
            top = tooltip.y + tooltip.caretHeight + tooltip.caretPadding;
          }
          var position = $(this._chart.canvas)[0].getBoundingClientRect();
          // Display, position, and set styles for font
          tooltipEl.css({
            opacity: 1,
            width: tooltip.width ? (tooltip.width + 'px') : 'auto',
            left: position.left + tooltip.x + 'px',
            top: position.top + top + 'px',
            fontFamily: tooltip._fontFamily,
            fontSize: tooltip.fontSize,
            fontStyle: tooltip._fontStyle,
            padding: tooltip.yPadding + 'px ' + tooltip.xPadding + 'px',
          });
        }
      }
    };
    var chart = new Chart(ctx, {
      type: 'doughnut',
      data: data,
      options: options
    });
  </script>
</body>

</html>
 reubenbrown
on 27 Sep 2016
reubenbrown
on 27 Sep 2016
@reubenbrown thanks! yours is the only working solution I could find for 2.3.0. Seems like this issue should be re-opened. Or is there a new one for 2.x?
 tlupfer
on 3 Nov 2016
tlupfer
on 3 Nov 2016
@tlupfer looking at the issues it seems there are a lot the pertain to the tooltip functionality but none that deal with this issue specifically in the latest version
reubenbrown
on 3 Nov 2016
I am also facing this tooltip positionising issue in DoughnutChart.

 Anujndls
on 17 Nov 2016
Anujndls
on 17 Nov 2016
I´m looking for solution too. Nothing working at all...
 miro4994
on 18 Nov 2016
miro4994
on 18 Nov 2016
@miro4994 the solution @reubenbrown posted above works, but you may have to tweak the positioning depending on your layout. I removed all of the code related to getBoundingClientRect to fit my layout.
tlupfer
on 18 Nov 2016
I'm also not satisfied with @reubenbrown 's solution. I'm already using a wrapper library for chart.js so I don't want to mess around with HTML and CSS that much. Isn't there a possibility to inject custom tooltip html using a callback function?
 apocalyarts
on 21 Nov 2016
apocalyarts
on 21 Nov 2016
Yep, sorry for the message before. I was little bit off my mude because i had to edit some stuff for making it work with react without jQuery. However, it´s working correctly so thank you @reubenbrown
miro4994
on 21 Nov 2016
@derekperkins this still happening on v2.4.0 —could we please reopen the issue?


 jminuscula
on 9 Dec 2016
jminuscula
on 9 Dec 2016
+1
 corysmc
on 23 Dec 2016
corysmc
on 23 Dec 2016
+1
apocalyarts
on 23 Dec 2016
Open Sesame!
derekperkins
on 23 Dec 2016
@etimberg Who is most into tooltips these days?
derekperkins
on 23 Dec 2016
@derekperkins not sure. No one really owns them specifically at the moment.
etimberg
on 23 Dec 2016
If someone wants to tale over the tooltip code, I'm happy to share
etimberg
on 23 Dec 2016
+1
 andresgleztelo
on 2 Feb 2017
andresgleztelo
on 2 Feb 2017
+1
 RichardM99
on 7 Feb 2017
RichardM99
on 7 Feb 2017
+1
 blubberbo
on 13 Mar 2017
blubberbo
on 13 Mar 2017
+1
 geek-at-heart
on 14 Mar 2017
geek-at-heart
on 14 Mar 2017
+1
 enistara
on 4 Apr 2017
enistara
on 4 Apr 2017
+1
 miladghiravani
on 5 Apr 2017
miladghiravani
on 5 Apr 2017
+1
Isn't there a simple way to change the size of the plot itself relative to the canvas? Say that for instance the piechart takes 50% of the width and height of canvas size ?
 damiendevienne
on 12 Apr 2017
damiendevienne
on 12 Apr 2017
I was able to get the tool tips to not cut off for me by making the width of the canvas tag larger. Make sure that maintainAspectRatio is set to true and then just make the width a little larger. Here's what it looked like for me: <canvas id="pieChart" style="width:180px; height:150px;"></canvas> Worked for my scenario and thought that it might help with others listed here.
 joebillman
on 18 Apr 2017
joebillman
on 18 Apr 2017
+1
 mce1978
on 5 Jun 2017
mce1978
on 5 Jun 2017
Also if the height of the canvas small enough the tooltip doesn't render on the left or right, it renders below the point which cuts it off.

 yashcr07
on 6 Jun 2017
yashcr07
on 6 Jun 2017
Am I correct in understanding that the solution is to use a custom HTML tooltip? (As opposed to the default one, which can never exceed the dimensions of the parent
 derryl
on 7 Jun 2017
derryl
on 7 Jun 2017
@derryl you are correct. Because the default tooltip renders on the canvas it can never render outside of it which is why it gets cut off.
etimberg
on 7 Jun 2017
@yashcr07 yes, use it in sparkline will fill very suck.
 geminiyellow
on 14 Jun 2017
geminiyellow
on 14 Jun 2017
Not complete solution but what I did was implement the method outlined in this post:
https://stackoverflow.com/questions/21409717/chart-js-and-long-labels
which separates the tooltip label text onto multiple lines. Seems to work well if the issue is that your label is too long to fit on one line!
 ChrisKatsaras
on 22 Jun 2017
ChrisKatsaras
on 22 Jun 2017
+1
 BossGrand
on 11 Aug 2017
BossGrand
on 11 Aug 2017
+1
 hernii8
on 8 Sep 2017
hernii8
on 8 Sep 2017
+1
 acenter2507
on 28 Sep 2017
acenter2507
on 28 Sep 2017
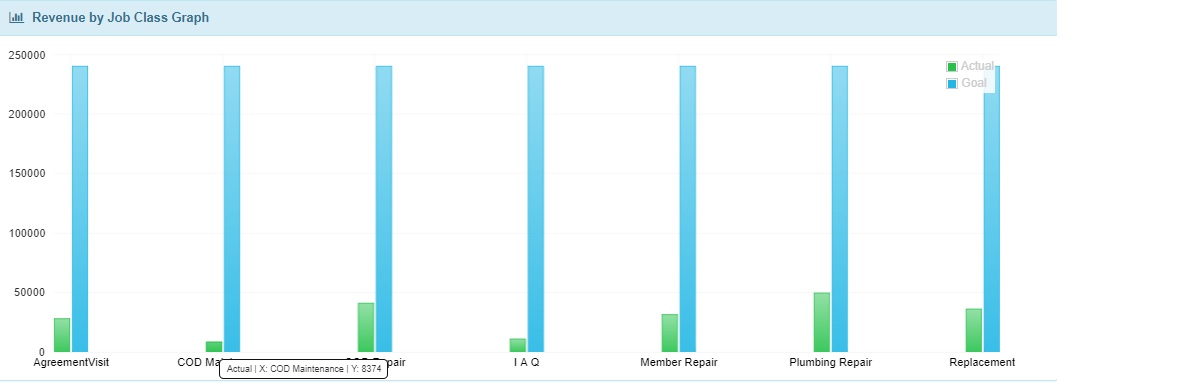
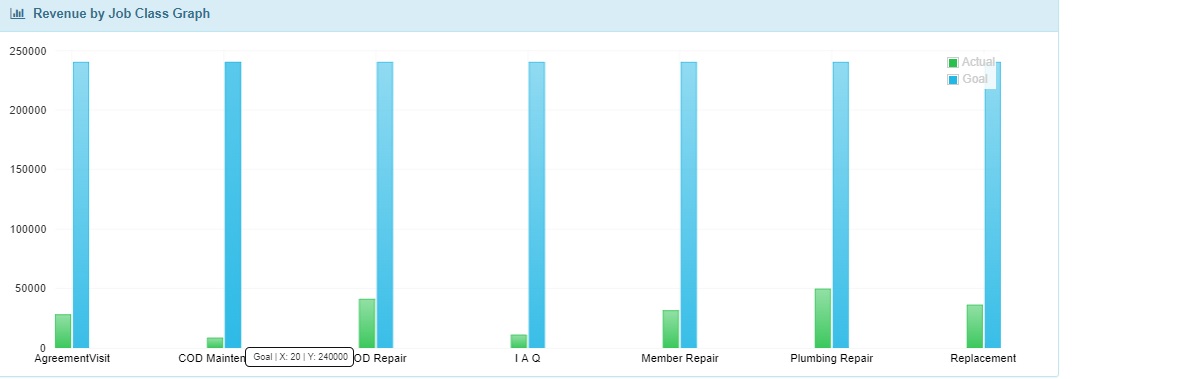
I am using tooltip but data on tooltip is showing incorrectly . I have two bar on bar is showing correctly but other is showing wrong. i am attaching image1 and image2 . In the image1 tooltip data is showing correctly on the green bar while in image2 on blue bar showing tooltip data in incorrectly. on the blue bar should also showing X axis value as green bar but its showing 20 instead of COD maintenance.
Please suggest someone.
 sumit1191
on 10 Oct 2017
sumit1191
on 10 Oct 2017
You can add internal padding to the chart. For instance in my case I had a cut of tooltips on the right.
                    options: {
                        responsive: true,
                        maintainAspectRatio: false,
                        cutoutPercentage: 60,
                        legend: {
                            display: false
                        },
                        animation: {
                            animateRotate: false
                        },
                        layout: {
                            padding: {
                                right: 40
                            }
                        }
                    }
 Eshva
on 3 Nov 2017
Eshva
on 3 Nov 2017
@Eshva It's not a solution, it doesn't solve the problem for every possible label. Tooltips should be outside of canvas by default, this is the only acceptable solution.
 ciembor
on 6 Mar 2018
ciembor
on 6 Mar 2018
@ciembor You mentioned that
this is the only acceptable solution
Could you please clarify a bit (explanation or link) what you mean by "this"?
Edited: I'm trying to process this thread; I'm still not sure what the recommended solution is.
 rinogo
on 19 Apr 2018
rinogo
on 19 Apr 2018
This limitation is native to the restrictions of the canvas not being able to draw anything outside of the the canvas element itself.
If this limitation is encountered, the only blessed workaround is to use custom tooltips, which render using the DOM, and not the canvas.
The maintainers of the repo are aware of this restriction and have decided that there is currently no feasible solution that would not come with very large breaking changes to the way tooltips work. It's possible that this will be addressed in the next major version of Chart.js, but it is not currently planned.
tannerlinsley
on 19 Apr 2018
I'm closing this issue since it doesn't appear to happen anymore
 benmccann
on 9 Jan 2020
benmccann
on 9 Jan 2020
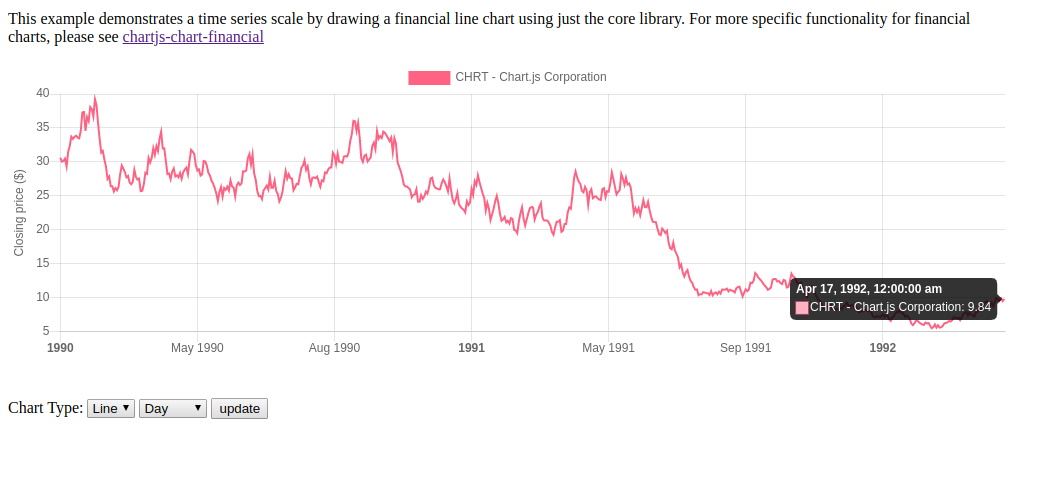
@benmccann: I still experience the issue with [email protected]:

 KeithGillette
on 9 Jan 2020
KeithGillette
on 9 Jan 2020
That looks like a bit of a different issue. It looks like it's not because it's the rightmost point, but because the legend is bigger than the chart. I'd recommend filing a new issue so that this one doesn't become too confusing
benmccann
on 9 Jan 2020
@benmccann Considering this https://github.com/chartjs/Chart.js/issues/1731 was merged into here, I wouldn't say its a new issue
 hawkinsjb1
on 5 Mar 2020
hawkinsjb1
on 5 Mar 2020
I followed #1731 here as well, and am encountering a similar issue:
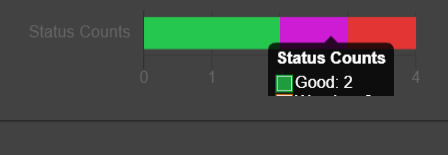 . Please let me know if you'd like me to open a new issue or something!
 s4m0r4m4
on 12 Mar 2020
s4m0r4m4
on 12 Mar 2020
@s4m0r4m4 yeah, if you can open a new issue with a reproducible test case on something like codepen or plunkr that would be great. The original report and possibly a majority of the comments here refer to an issue where the tooltip is mispositioned. It'd be a lot easier to keep track of if we have a clean report that describes the remaining issue of the tooltip overflowing because it's too large. It's not clear to me what the best fix would be for this remaining case and it may require a fair amount of discussion. I'd like that not to get lost amongst all the existing discussion of the already fixed issue so that we capture everyone's input and feedback
benmccann
on 12 Mar 2020
One improvment for the current case when there are too many lines, like in my case 50, it is always below the line picked instead of the side where the biggest tooltip can be shown.
In my case it would be good to show the tooltip above the line, to see more, even if not all tooltips

 MichaelPeter
on 25 Mar 2020
MichaelPeter
on 25 Mar 2020
Padding is the solution for me: https://stackoverflow.com/a/57360344/3650955
 ufukomer
on 7 Jul 2020
ufukomer
on 7 Jul 2020
Any updates on this issue? There is a new Chart.js version coming up, would tooltip cut-off issue be solved in the upcoming major release?
 shyamal890
on 27 Nov 2020
shyamal890
on 27 Nov 2020
Related issues
 lizbanach
·
3Comments
lizbanach
·
3Comments
 frlinw
·
3Comments
frlinw
·
3Comments
 nickgoodliff
·
3Comments
nickgoodliff
·
3Comments
 adriantombu
·
3Comments
adriantombu
·
3Comments
 HeinPauwelyn
·
3Comments
HeinPauwelyn
·
3Comments
Most helpful comment
Interestingly, by setting the "tooltipCaretSize" option to "0" solves the issue
{ tooltipCaretSize: 0, ... }