Chart.js: [BUG] Stacked bar using time axis without having the same datetime
Expected Behavior
Create a stacked bar using time axis with different datetime in the datasets. For example:
datasets:
  [
    {
      label: 'A',
      data:
      [
        {
          x: "01-01-2018",
          y: 12
        },
        {
          x: "02-01-2018",
          y: 15
        },
      ],
    },
    {
      label: 'B',
      data:
      [
        {
          x: "02-01-2018",
          y: 23
        },
        {
          x: "03-01-2018",
          y: 34
        },
        {
          x: "04-01-2018",
          y: 45
        },
      ]
    }
  ],
In this example dataset B haven't the point at "01-01-2018"
Current Behavior
Currently, using the stacked bar with time axis need the datasets having the same point datatime even if some point is set to 0.
datasets:
  [
    {
      label: 'A',
      data:
      [
        {
          x: "01-01-2018",
          y: 12
        },
        {
          x: "02-01-2018",
          y: 15
        },
      ],
    },
    {
      label: 'B',
      data:
      [
        {
          x: "01-01-2018",
          y: 0
        },
        {
          x: "02-01-2018",
          y: 23
        },
        {
          x: "03-01-2018",
          y: 34
        },
        {
          x: "04-01-2018",
          y: 45
        },
      ]
    }
  ],
Possible Solution
Calculate the height of the single bar looking for every datasets if the datetime is present or not
Steps to Reproduce (for bugs)
Here the problem on stackoverflow
Here the jsfiddle
Context
I want show the stacked bar without having to manipulate all the datasets for add the missing point.
Environment
- Chart.js version: 2.7.2
- Browser name and version: Firefox 61.0.1
 stukdev
All 7 comments
The problem is in calculateBarValuePixels function. The scale.getRightValue(datasets[i].data[index]); function have to check if the axis is a time axis.
stukdev
on 17 Sep 2018
@simonbrunel Can i do something for fix this problem?
stukdev
on 15 Nov 2018
I don't think there is any easy way to fix this issue because the stacking logic requires values to be at the same data index in order to be stacked, which means it's not compatible with {x,y} data. It would be the same issue with a linear scale instead of a time scale (getRightValue() isn't the problem).
I agree that we should correctly handle that use case but IMO, it would require a major rewrite of this logic, so converting your data upfront seems the easiest and fastest solution right now.
 simonbrunel
on 15 Nov 2018
simonbrunel
on 15 Nov 2018
Ran into this issue myself recently trying to stack line graphs with point data. Each data set was contiguous but not the same length (some starting later on the time based x axis). We definitely burned some time trying to understand what was happening here.
 trickhub
on 30 Jan 2019
trickhub
on 30 Jan 2019
+1
This is also bugging us in our project. It would be great if you guys could provide a fix for this.
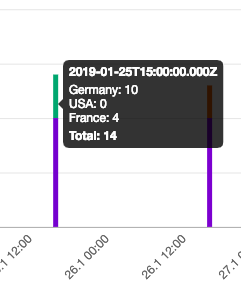
Otherwise we always have to fill up the datasets, which lack certain ticks and set there a value ‘0’, which is then unfortunately also shown in the unified tooltip as value 0 for that particular dataset.
We want to dynamically load a bunch of different records (last month, last week, etc.) these contain diverse datasets per chunk. These datasets are different in length/number.
Therefore we have to determine the order and enhancing of the datasets ourselves and this would be necessary with every reload/view change.
As seen here:
Here is a stackblitz for it:
Stackblitz
 cnschwarz
on 28 Feb 2019
cnschwarz
on 28 Feb 2019
+1
 zicons
on 1 Mar 2019
zicons
on 1 Mar 2019
+1
 manitwo
on 1 Mar 2019
manitwo
on 1 Mar 2019
Related issues
 benmccann
·
3Comments
benmccann
·
3Comments
 lbowers
·
3Comments
lbowers
·
3Comments
 bytesnz
·
3Comments
bytesnz
·
3Comments
 JewelsJLF
·
3Comments
JewelsJLF
·
3Comments
 adriantombu
·
3Comments
adriantombu
·
3Comments
Most helpful comment
+1
This is also bugging us in our project. It would be great if you guys could provide a fix for this.
Otherwise we always have to fill up the datasets, which lack certain ticks and set there a value ‘0’, which is then unfortunately also shown in the unified tooltip as value 0 for that particular dataset.
We want to dynamically load a bunch of different records (last month, last week, etc.) these contain diverse datasets per chunk. These datasets are different in length/number.
Therefore we have to determine the order and enhancing of the datasets ourselves and this would be necessary with every reload/view change.
As seen here:

Here is a stackblitz for it:
Stackblitz