Chart.js: real time chart with High CPU Usage > 300% In Chrome
I encounter a high cpu usage issue for this sample code after a 5 mins running.
https://codepen.io/orchestor/pen/pLGjqL
Can someone point out any reason on this real time display?
 orchestor
All 6 comments
New Comment: There is no high cpu usage issue when I use Safari browser.
orchestor
on 25 May 2018
I'm experiencing no issue on Win10 64bit / Chrome 66
What browser version, OS, etc. ?
Did you try to profile what consumes so much CPU?
Are you sure it's related to Chart.js and not another lib or even Chrome extensions?
 simonbrunel
on 28 May 2018
simonbrunel
on 28 May 2018
I am using
- mac os 10.11.6.
- chrome Version 66.0.3359.139 (Official Build) (64-bit)
- tried in chrome incognito mode: same
Here is profile status:
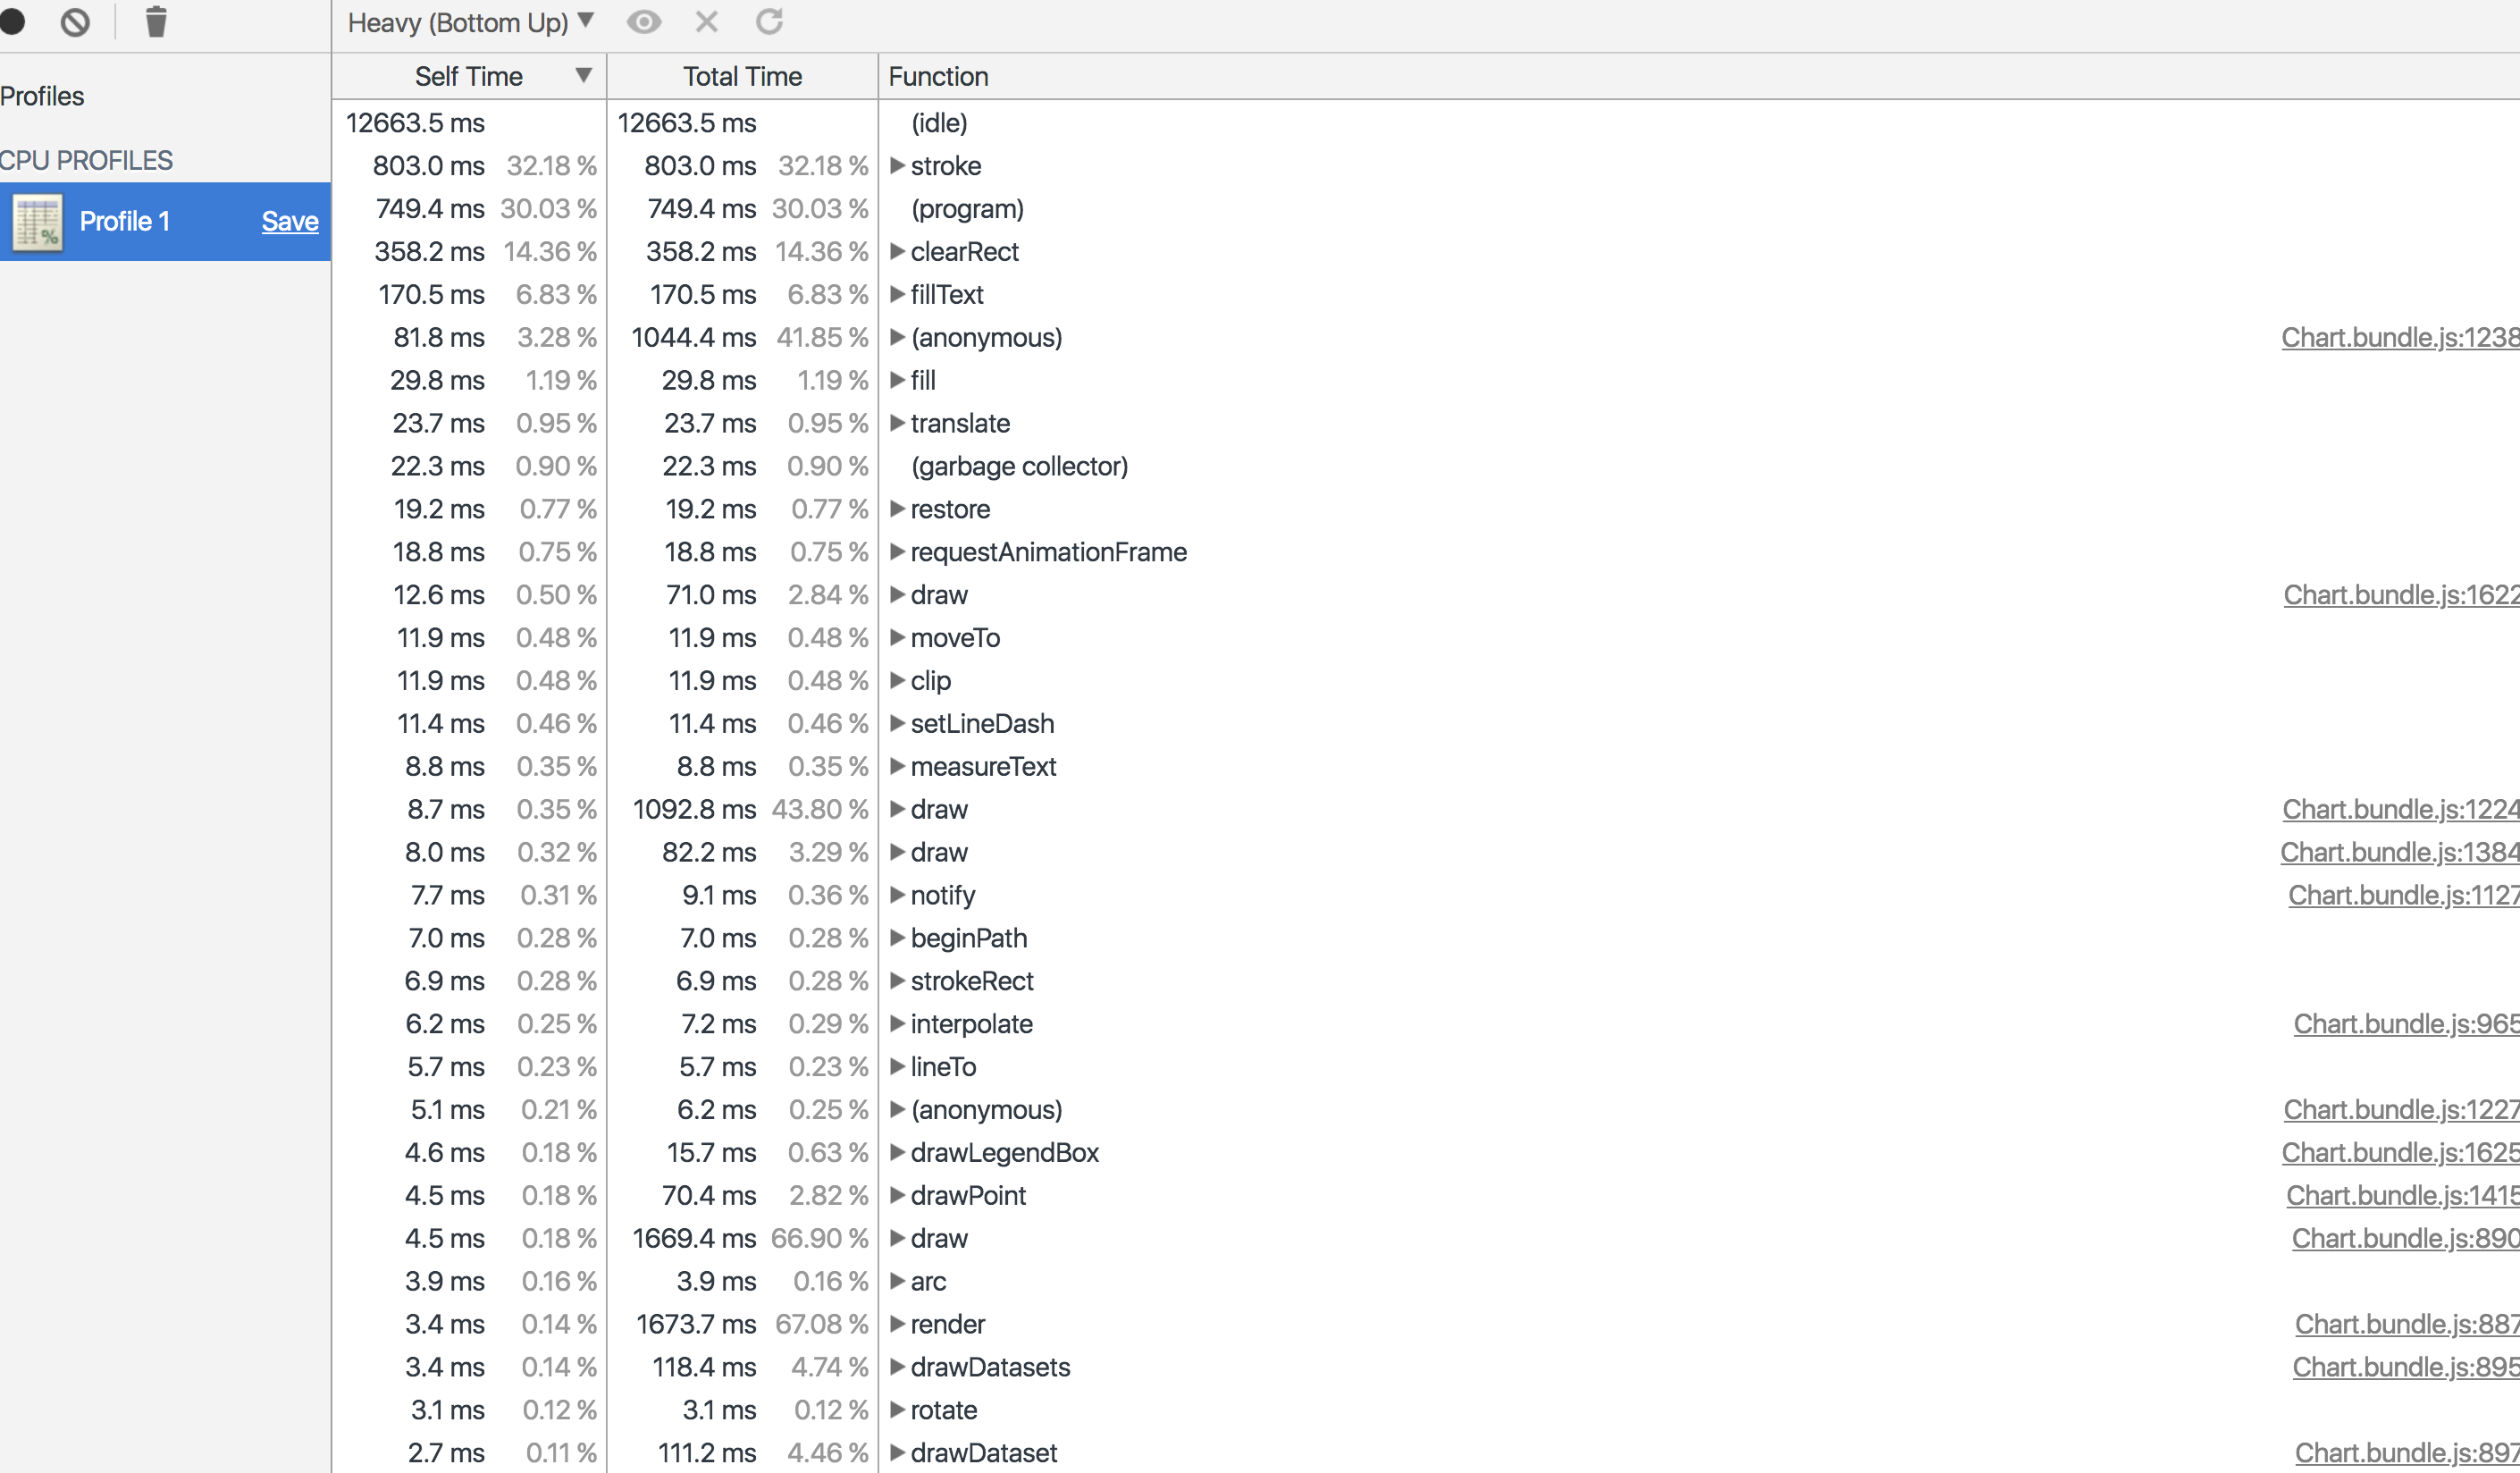
2.0 ms0.08 % | 1698.3 ms68.06 % | (anonymous)Chart.bundle.js:8261
2.2 ms0.09 % | 1696.2 ms67.98 % | startDigestChart.bundle.js:0
1.6 ms0.07 % | 1675.5 ms67.15 % | callbackChart.bundle.js:0
0 ms0 % | 1675.5 ms67.15 % | advanceChart.bundle.js:0
3.4 ms0.14 % | 1673.7 ms67.08 % | renderChart.bundle.js:8877
4.5 ms0.18 % | 1669.4 ms66.90 % | drawChart.bundle.js:8900
2.3 ms0.09 % | 1181.8 ms47.36 % | eachChart.bundle.js:14424
2.2 ms0.09 % | 1167.7 ms46.80 % | (anonymous)Chart.bundle.js:8916
2.0 ms0.08 % | 1111.3 ms44.53 % | eachChart.bundle.js:0
8.7 ms0.35 % | 1092.8 ms43.80 % | drawChart.bundle.js:12240
81.8 ms3.28 % | 1044.4 ms41.85 % | (anonymous)Chart.bundle.js:12386
803.0 ms32.18 % | 803.0 ms32.18 % | stroke
749.4 ms30.03 % | 749.4 ms30.03 % | (program)
0 ms0 % | 360.1 ms14.43 % | clearChart.bundle.js:8511
1.9 ms0.08 % | 360.1 ms14.43 % | clearChart.bundle.js:14123
358.2 ms14.36 % | 358.2 ms14.36 % | clearRect
170.5 ms6.83 % | 170.5 ms6.83 % | fillText
3.4 ms0.14 % | 118.4 ms4.74 % | drawDatasetsChart.bundle.js:8950
2.7 ms0.11 % | 111.2 ms4.46 % | drawDatasetChart.bundle.js:8972
2.6 ms0.10 % | 104.0 ms4.17 % | drawChart.bundle.js:7683
8.0 ms0.32 % | 82.2 ms3.29 % | drawChart.bundle.js:13840
12.6 ms0.50 % | 71.0 ms2.84 % | drawChart.bundle.js:16227
4.5 ms0.18 % | 70.4 ms2.82 % | drawPointChart.bundle.js:14157
1.5 ms0.06 % | 58.4 ms2.34 % | (anonymous)Chart.bundle.js:0
2.3 ms0.09 % | 32.9 ms1.32 % | fillTextChart.bundle.js:16299
29.8 ms1.19 % | 29.8 ms1.19 % | fill
0.1 ms0.01 % | 25.3 ms1.01 % | (anonymous)pen.js:73
0.4 ms0.02 % |
orchestor
on 12 Jun 2018
I also tried making a realtime chart and found the performance pretty bad. Here's a flame graph of what I was seeing: https://www.dropbox.com/s/o8ybl413mtjgr2b/Screenshot%202020-05-19%2014.56.58.png?dl=0 -- it seems like creating ticks takes up lots of CPU
 theicfire
on 20 May 2020
theicfire
on 20 May 2020
@theicfire I would recommend using Chart.js 3.0.0-alpha for anything performance intensive since performance has been the major focus of 3.0. Also, take a look at https://www.chartjs.org/docs/next/general/performance
 benmccann
on 20 May 2020
benmccann
on 20 May 2020
@theicfire here's a demo of a realtime chart on 3.0: https://github.com/chartjs/Chart.js/issues/7243#issuecomment-631615371
benmccann
on 20 May 2020
Related issues
 nanospeck
·
3Comments
nanospeck
·
3Comments
 JewelsJLF
·
3Comments
JewelsJLF
·
3Comments
 JAIOMP
·
3Comments
JAIOMP
·
3Comments
 Woogles
·
3Comments
Woogles
·
3Comments
 gabrieldesouza
·
3Comments
gabrieldesouza
·
3Comments