Chart.js: [BUG?] Too many datapoints being hovered/in tooltip (mode: 'x')
If you create a chart with hover-mode 'x'/tooltip-mode 'x' and many values in its datasets (try 500), tooltips will be looking like this:
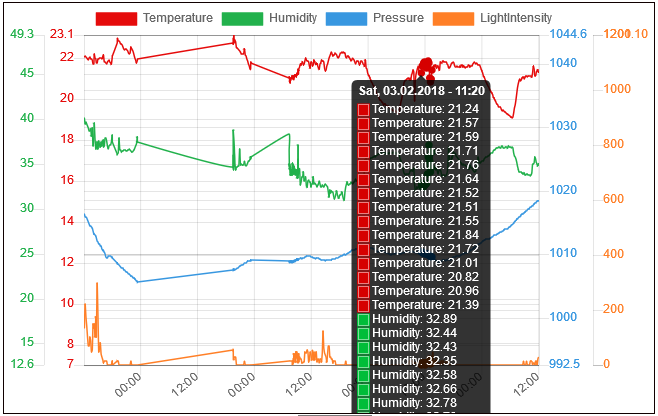
As you can see in the image more than one datapoint per dataset is being 'hovered' and congruously the tooltip shows all of them.
I would expect to see only the one datapoint per dataset, which is closest to the mouse cursor, (preferred method) OR the API to give me a convenient way to limit the number of datapoints per dataset.
Situation can be improved by reducing the hoverRadius. But this also decreases usability. Is the 'filter' callback perhaps an option here? The 'index' mode is not an option in this scenario, because values can be missing from time to time in one dataset or the other.
Thank you for your efforts!
 mwoco
mwoco
All 7 comments
@mwoco do you have a fiddle that reproduces this?
There is a filter on the tooltip that could be used.
 etimberg
on 4 Feb 2018
mwoco
on 5 Feb 2018
etimberg
on 4 Feb 2018
mwoco
on 5 Feb 2018
Anyone working on this? Do you mind if I try to fix it?
 MPierre9
on 10 Mar 2018
MPierre9
on 10 Mar 2018
@MPierre9 you're welcome to have a look at it. I would look at the code in https://github.com/chartjs/Chart.js/blob/master/src/core/core.interaction.js
etimberg
on 10 Mar 2018
Thanks for the tip @etimberg, it really helped!
MPierre9
on 12 Mar 2018
I realize that there is a PR in the pipeline currently that will allow for the tooltip filter to handle this a bit better, but I needed a solution ASAP and I figured I'd share what I did in case anyone is looking for something quick and dirty until #7324 gets merged in.
WARNING: I'm accessing private variables of the chart, so this really only should be used as a temporary measure until the PR is merged in. If this blows up in production, you were warned.
first, I've created a reference the the Chart instance in a scope that is accessible to the chart configuration. I added the following tooltip configuration with filter function. It's probably best to check first if there are any active tooltips before grabbing the index.
tooltips: {
          mode: 'x',
          intersect: false,
          filter(item: Chart.ChartTooltipItem, data: Chart.ChartData) {
            const currentIndex = lineChart.tooltip._active[0]._index;
            return item.index === currentIndex;
          }
        },
Again, both _active and _index are private variables so they may change at any time.
 instantaphex
on 15 Jun 2020
instantaphex
on 15 Jun 2020
So part of this is how mode: 'x' works. It finds all the things that pass a hit-test check. If multiple points overlap, they will all be returned. A point is considered in range if the distance(point.center, mouseEvent) < point.radius + point.hitRadius hence why multiple points are found here.
The filter work was done in #7556 and there is a better mode to use to achieve this behaviour. If the mode is set to 'nearest' and then the axis is set to 'x', the single nearest item along the X axis from the event position will be found. See https://codepen.io/etimberg/pen/bGepzqy
Between the filter and the better mode, I am going to call this resolved.
etimberg
on 17 Oct 2020
Related issues
 HeinPauwelyn
·
3Comments
HeinPauwelyn
·
3Comments
 akashrajkn
·
3Comments
akashrajkn
·
3Comments
 JewelsJLF
·
3Comments
JewelsJLF
·
3Comments
 JAIOMP
·
3Comments
JAIOMP
·
3Comments
 frlinw
·
3Comments
frlinw
·
3Comments
Most helpful comment
So part of this is how
mode: 'x'works. It finds all the things that pass a hit-test check. If multiple points overlap, they will all be returned. A point is considered in range if thedistance(point.center, mouseEvent) < point.radius + point.hitRadiushence why multiple points are found here.The filter work was done in #7556 and there is a better mode to use to achieve this behaviour. If the mode is set to
'nearest'and then theaxisis set to'x', the single nearest item along the X axis from the event position will be found. See https://codepen.io/etimberg/pen/bGepzqyBetween the filter and the better mode, I am going to call this resolved.