Chart.js: Clipping around the chart area.
Expected Behavior
Bubble in bubble chart should goes under X axis like an sunset.
Current Behavior
When I have bubble chart and it has some positive bubble value with center close to X axis, part of bubble shown below X
Possible Solution
Not sure how to implement but it would be great if nothing will go outside X axis below it. So it's like part of bubble should go below X axis and be hidden. Like an sunset.
Steps to Reproduce (for bugs)
- create chart wit bubbles
- one of the bubble value should have small value by Y axis so it would be close to X Axis and part of that bubble would be under X axis.
Context
Environment
- Chart.js version: 2.x
- Browser name and version: Chrome
- Link to your project: restricted
 Th3An1m4l
All 15 comments
A screenshot and/or fiddle would help
 benmccann
on 31 Jan 2018
benmccann
on 31 Jan 2018
if i understand correctly, you'd like the axis drawn on top of the point? Or would you like the point to only be a half circle
 etimberg
on 1 Feb 2018
etimberg
on 1 Feb 2018
half circle as an sunset
Th3An1m4l
on 1 Feb 2018
That requires changing the drawing code. I think the way to handle this would be to add some kind of arc angle parameter to the point drawing and default it to 2 * Math.PI
etimberg
on 2 Feb 2018
@Th3An1m4l Can you post a screenshot of what you are expecting?
 simonbrunel
on 2 Feb 2018
simonbrunel
on 2 Feb 2018
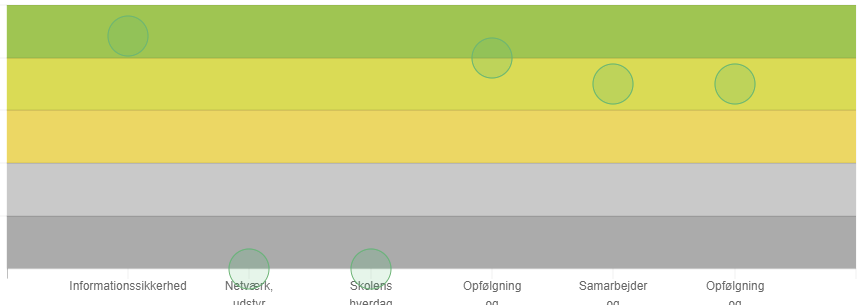
as we have
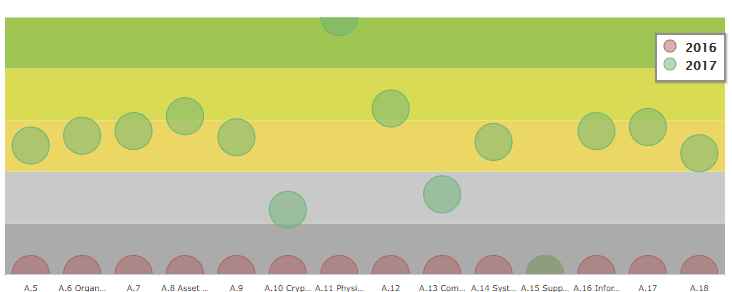
as we need
Th3An1m4l
on 2 Feb 2018
Looks like you simply want clipping around the chart area, right?
simonbrunel
on 2 Feb 2018
yes )) or like this, any solution will help
Th3An1m4l
on 2 Feb 2018
Closed by mistake. Any solution suggested?
Th3An1m4l
on 9 Feb 2018
is there any ideas?
Th3An1m4l
on 11 Feb 2018
I can't get it work without bubbles run out of chart area, but extremely need it. In any case it looks like wrong behavior.
Th3An1m4l
on 14 Feb 2018
I think we need to add options to control dataset clipping instead of hard-coding this behavior and avoid a specific use case that might not fit well for everyone (as it's the case for line and bar controllers).
For now, you can write a simple plugin (jsfiddle):
var clipper = {
  beforeDatasetsDraw: function(chart) {
    Chart.helpers.canvas.clipArea(chart.ctx, chart.chartArea);
  },
  afterDatasetsDraw: function(chart) {
    Chart.helpers.canvas.unclipArea(chart.ctx);
  }
};

new Chart('chart', {
  plugins: [clipper]
});
Awesome! Thanks. I'll try it.
Th3An1m4l
on 14 Feb 2018
Super! It works perfect! Exactly what we need.
Th3An1m4l
on 14 Feb 2018
Is there a way to prevent tooltips from appearing when the cursor is outside the chart area? The problem occurs also after zooming in on a bar chart: bars are not displayed under the ticks area, but tooltips appear anyway.
 adamsol
on 29 Sep 2020
adamsol
on 29 Sep 2020
Related issues
 SylarRuby
·
3Comments
SylarRuby
·
3Comments
 nanospeck
·
3Comments
nanospeck
·
3Comments
 akashrajkn
·
3Comments
akashrajkn
·
3Comments
 JewelsJLF
·
3Comments
JewelsJLF
·
3Comments
 bytesnz
·
3Comments
bytesnz
·
3Comments
Most helpful comment
I think we need to add options to control dataset clipping instead of hard-coding this behavior and avoid a specific use case that might not fit well for everyone (as it's the case for line and bar controllers).
For now, you can write a simple plugin (jsfiddle):