Chart.js: pie chart center text not centered
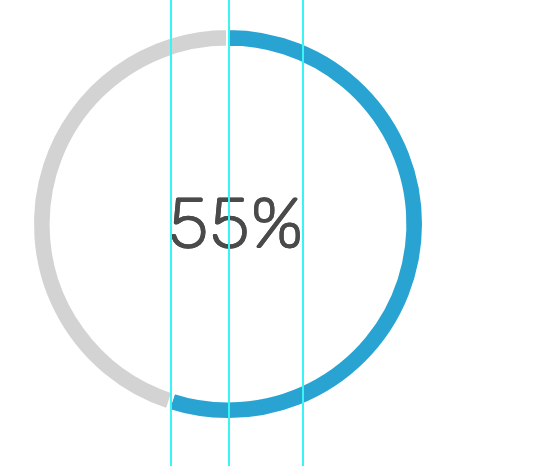
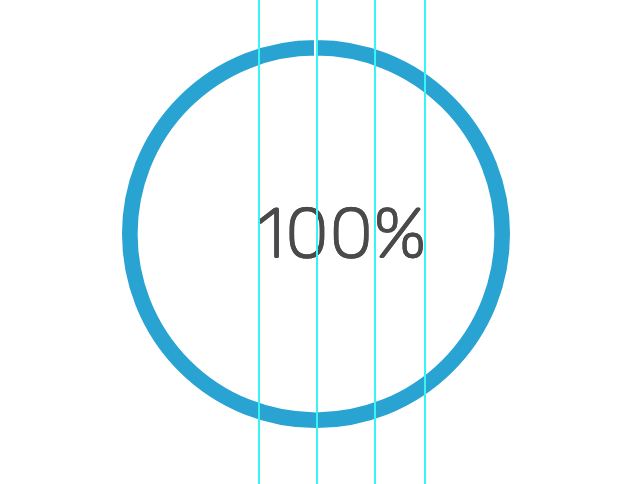

It looks like its centering according to the numbers and not the percent sometimes, but then for 55 percent. I'm not sure what it's centering according to.
Any ideas for centering this as internal canvas elements cannot be positioned by css? or am I wrong?
 spencer1573
All 7 comments
@spencer1573 how are you drawing the text?
 etimberg
on 18 Jan 2018
etimberg
on 18 Jan 2018
@etimberg i'm using vue chart.js could that have something to do with it?
spencer1573
on 20 Jan 2018
import { Doughnut } from 'vue-chartjs'
export default Doughnut.extend({
props: ['data'],
mounted () {
this.renderChart({
labels: ['Completed', 'Remaining'],
legend: {
display: false
},
datasets: [
{
backgroundColor: ['#1BA2d4', 'lightgrey'],
data: [this.data, 100 - this.data]
}
]
}, {
responsive: true,
maintainAspectRatio: false,
cutoutPercentage: 90,
legend: {
display: false
},
tooltips: {
enabled: false
// custom: function (tooltipModel) {
// // Tooltip Element
// // console.log('tm', tooltipModel)
// var tooltipEl = document.getElementById('chartjs-tooltip')
// console.log(tooltipEl)
// console.log('d', document)
// // tooltipEl.onClick(console.log('it worked'))
// }
},
hover: {
mode: false
},
// onClick: clickEvent,
animation: {
duration: 500,
onProgress: function (animation) {
var chartContext = this.chart.canvas.getContext('2d', {alpha: false})
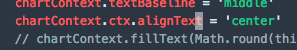
chartContext.fillStyle = '#4a4a4a'
chartContext.font = '100 36px Rubik'
chartContext.textBaseline = 'middle'
chartContext.fillText(Math.round(this.data.datasets[0].data[0]) + '%', this.chart.width / 2 - 30, this.chart.height / 2, 200)
},
onComplete: function (animation) {
var chartContext = this.chart.canvas.getContext('2d', {alpha: false})
chartContext.fillStyle = '#4a4a4a'
chartContext.font = '100 36px Rubik'
chartContext.textBaseline = 'middle'
chartContext.fillText(Math.round(this.data.datasets[0].data[0]) + '%', this.chart.width / 2 - 30, this.chart.height / 2, 200)
}
}
})
}
})
that's the component that is making the chart. thanks for responding @etimberg
spencer1573
on 20 Jan 2018
the way I see it is that unless its an option on chart.js, I can't modify the canvas that chart.js generates. Am I right about that?
spencer1573
on 20 Jan 2018
@spencer1573 I would try setting chartContext.ctx.textAlign = 'center' before you fill the text and then remove the -30 from the x calculation.
The -30 is probably the problem. You'd need to use chartContext.measureText to measure the length of the text, determine the width and then subtract half.
etimberg
on 20 Jan 2018
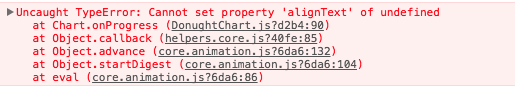
it looks like there is something wrong with ctx when I'm using vue-chart
i did find out that i can calculate what it should look like for each percentage, which is super hacky but i just need this thing to work.
you helped me so much to find out that - 30, i had no idea that was doing anything to the x. Thank you thank you thank you! @etimberg
spencer1573
on 26 Jan 2018
Glad I could help 😄 I think you need to set the property as textAlign not alignText.
etimberg
on 26 Jan 2018
Related issues
 joebirkin
·
3Comments
joebirkin
·
3Comments
 gouthamrv
·
3Comments
gouthamrv
·
3Comments
 bytesnz
·
3Comments
bytesnz
·
3Comments
 nanospeck
·
3Comments
nanospeck
·
3Comments
 nickgoodliff
·
3Comments
nickgoodliff
·
3Comments
Most helpful comment
that's the component that is making the chart. thanks for responding @etimberg