Hello, I love this plugin to be able to create charts. However, I've looked and cannot understand or find a way to use the legendCallback function to create an HTML legend.
Can you provide a link or an example of how to use the legendCallback or chartInstance.generateLegend? I have read the documentation and scoured the issues, but am not familiar on how to customize this code. What does the HTML legend look like?
 sensaetions
All 13 comments
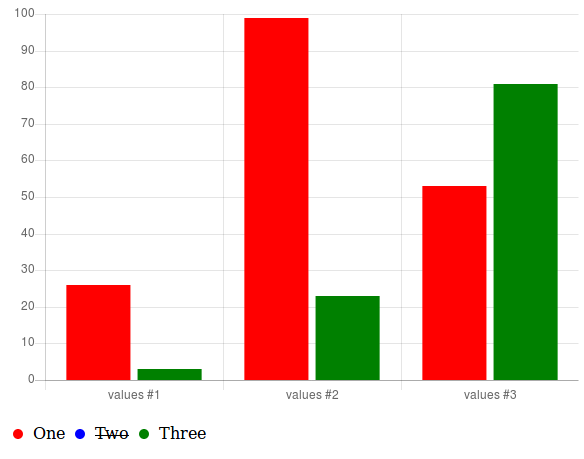
@sensaetions The default generateLegend() function will generate a <ul class="0-legend"> for the chart, which you can style using the css descriptor [class="0-legend"]. The 0 is the chart.id.
In the following example you'll find a chart with a HTML generated legend, which mimics the default legend.
CSS
[class="0-legend"] {
  list-style: none;
  cursor: pointer;
  padding-left: 0;
}
[class="0-legend"] li {
  display: inline-block;
  padding: 0 5px;
}
[class="0-legend"] li.hidden {
  text-decoration: line-through;
}
[class="0-legend"] li span {
  border-radius: 5px;
  display: inline-block;
  height: 10px;
  margin-right: 10px;
  width: 10px;
}
JavaScript to create HTML legend
var myLegendContainer = document.getElementById("myChartLegend");

// generate HTML legend
myLegendContainer.innerHTML = myChart.generateLegend();

// bind onClick event to all LI-tags of the legend
var legendItems = myLegendContainer.getElementsByTagName('li');
for (var i = 0; i < legendItems.length; i += 1) {
  legendItems[i].addEventListener("click", legendClickCallback, false);
}
JavaScript legend onClick callback
function legendClickCallback(event) {
  event = event || window.event;

  var target = event.target || event.srcElement;
  while (target.nodeName !== 'LI') {
      target = target.parentElement;
  }
  var parent = target.parentElement;
  var chartId = parseInt(parent.classList[0].split("-")[0], 10);
  var chart = Chart.instances[chartId];
  var index = Array.prototype.slice.call(parent.children).indexOf(target);

  chart.legend.options.onClick.call(chart, event, chart.legend.legendItems[index]);
  if (chart.isDatasetVisible(index)) {
    target.classList.remove('hidden');
  } else {
    target.classList.add('hidden');
  }
}
default legendCallback
Edit: modified legendClickCallback to call the chart onClick-event.
 jcopperfield
on 22 Dec 2017
jcopperfield
on 22 Dec 2017
Really nice @jcopperfield! I'm not sure we have an example for HTML legend, would you like to add this one to our samples?
 simonbrunel
on 23 Dec 2017
simonbrunel
on 23 Dec 2017
Great example @jcopperfield! Let’s add it as a sample :)
 etimberg
on 23 Dec 2017
etimberg
on 23 Dec 2017
@simonbrunel and @etimberg the CSS class 0-legend makes the styling harder because you need to use [class="0-legend"] instead of the more common dot-selector. Could we change the legend UL to <ul id="legend-' + chart.id + '" class="chartjs-legend"> to make styling easier. Or would removing the ${chart.id}-legend-class break existing projects?
I have to admit that I'm not even sure, there is any advantage of having the code inside the ChartJS library. It doesn't make it easier to create a HTML styled legend, since the hardest part is onClick-event. Not having a common CSS selector makes styling harder and for multiple charts it would be easier to create a custom legendCallback.
Couldn't we just remove the code from the library and add an example to documentation with a fully customized HTML legend?
jcopperfield
on 23 Dec 2017
@jcopperfield I totally agree, it would be better to not have the HTML legend in the core library, I would prefer a chartjs-plugin-htmllegend plugin instead, but it's here since years and removing this code would break many projects.
I also agree that the CSS selector is a bit weird, I'm fine to change it but we need to keep the actual class. I would go for: <ul class="' + chart.id + '-legend' + ' chartjs-legend"> (I would not add the ul id).
simonbrunel
on 25 Dec 2017
The HTML legend is working great except when testing the functionality of hide/show with pie/doughnut chart. I'm getting the following error:
TypeError: Cannot read property '_meta' of undefined
    at t.getDatasetMeta
I'm wondering if it is just me. did anyone got it working on pie chart?
It's my first comment here in Chart.js so I gotta say thank you all for this amazing product :]
EDIT: I figured it's probably not the best place to post this, so I copied to SO O_o
EDIT-2: The pie/doughnut chart needs some further adjustment if you use the same dataset as I did. check out this page
 Shriken
on 8 Jan 2018
Shriken
on 8 Jan 2018
@etimberg, @jcopperfield,
This is a follow-up question to the HTML legend. Is it possible and how can I split the legend items into different categories? For example, I only want legend items #1-3 to show up in one legend, and legend items #4-10 in another legend?
sensaetions
on 13 Mar 2018
@etimberg @jcopperfield Any updates or response to my latest question about splitting up the legend items into different categories?
sensaetions
on 20 Mar 2018
@sensaetions you can add a custom legendCallback to the options and then only return HTML for the datasets you want to appear in the legend.
etimberg
on 21 Mar 2018
@etimberg As I want the legend items to only show up as the data itself is being added to the chart, I ended up customizing and building the legend with non-javascript. Thank you for your help!
sensaetions
on 21 Mar 2018
If the feature was removed shouldn't you remove the HTML Legends documentation?
 Plonq
on 30 Apr 2020
Plonq
on 30 Apr 2020
It was removed in 3.0, which has not been released yet. It was removed from the 3.0 documentation: https://www.chartjs.org/docs/next/configuration/legend
 benmccann
on 30 Apr 2020
benmccann
on 30 Apr 2020
It was removed in 3.0, which has not been released yet. It was removed from the 3.0 documentation: https://www.chartjs.org/docs/next/configuration/legend.html
Ah, apologies.
Plonq
on 30 Apr 2020
Related issues
 gouthamrv
·
3Comments
benmccann
·
3Comments
gouthamrv
·
3Comments
benmccann
·
3Comments
 lbowers
·
3Comments
lbowers
·
3Comments
 longboy
·
3Comments
longboy
·
3Comments
 frlinw
·
3Comments
frlinw
·
3Comments
Most helpful comment
@sensaetions The default

generateLegend()function will generate a<ul class="0-legend">for the chart, which you can style using thecssdescriptor[class="0-legend"]. The0is thechart.id.In the following example you'll find a chart with a HTML generated legend, which mimics the default legend.
CSS
JavaScript to create HTML legend
JavaScript legend onClick callback
default legendCallback
https://github.com/chartjs/Chart.js/blob/ce1fc28b743d518add5c89653108a287f6aa911d/src/plugins/plugin.legend.js#L67-L80
Edit: modified
legendClickCallbackto call the chart onClick-event.