Chart.js: Bar chart get pixelforvalue at zero.
Hello, I try to draw two line beside the mouse move.
I found solution with chartjs line but when I use bar my solution doesn't work, because when I try to get the pixelForValue on my axis X, the value have a padding to the right from the base axis.
That is because bar chart never begin at zero.
I made jsfiddle for that :
https://jsfiddle.net/YvanBarbaria/g210L7Lz/5/
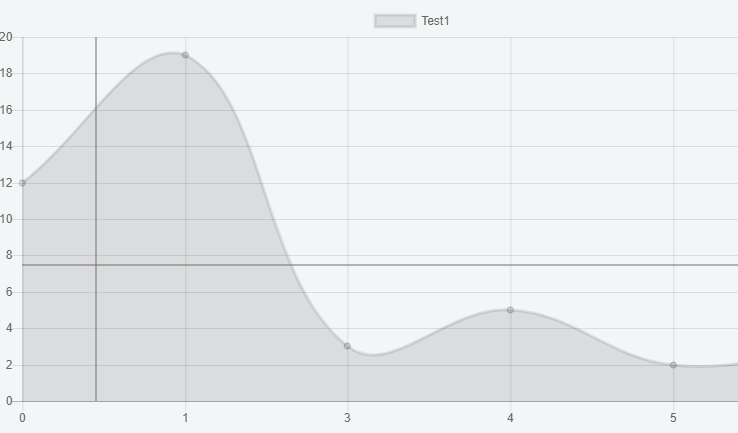
Actual with bar :

Expected :
 ybarbaria
All 5 comments
I think the best solution here is to just draw the lines at the raw mouse coordinates rather than at the value of the bar
 etimberg
on 14 Oct 2017
etimberg
on 14 Oct 2017
@etimberg I am not sure to understand what I need to do. For the moment, I try to draw the two line start from the axis.
I try to draw one line start from the x of the point directly to the end of the y axis and from the beginning and same for the y of point with the max and min value of the x axis. But with the bar chart I can't draw the horizontal line from the start of the axis x...
ctx.moveTo(xScale.getPixelForValue(xScale.max), point.y);
  ctx.lineTo(xScale.getPixelForValue(xScale.min),point.y);
  ctx.moveTo(point.x, yScale.getPixelForValue(yScale.max));
  ctx.lineTo(point.x, yScale.getPixelForValue(yScale.min));
  ctx.stroke();
Ok I find a solution instead of getting pixelForValue, I use the top, bottom, left and right values of the axis.
ctx.moveTo(xScale.left, point.y);
      ctx.lineTo(xScale.right,point.y);
      ctx.moveTo(point.x, yScale.top);
      ctx.lineTo(point.x, yScale.bottom);
ybarbaria
on 14 Oct 2017
@ybarbaria yup, that's a better way to do it. Or, use chart.chartArea
etimberg
on 14 Oct 2017
Closing this since it sounds like you've found a solution
 benmccann
on 15 Oct 2017
benmccann
on 15 Oct 2017
Related issues
 akashrajkn
·
3Comments
akashrajkn
·
3Comments
 nanospeck
·
3Comments
nanospeck
·
3Comments
 kennsippell
·
3Comments
kennsippell
·
3Comments
 Woogles
·
3Comments
Woogles
·
3Comments
 gouthamrv
·
3Comments
gouthamrv
·
3Comments