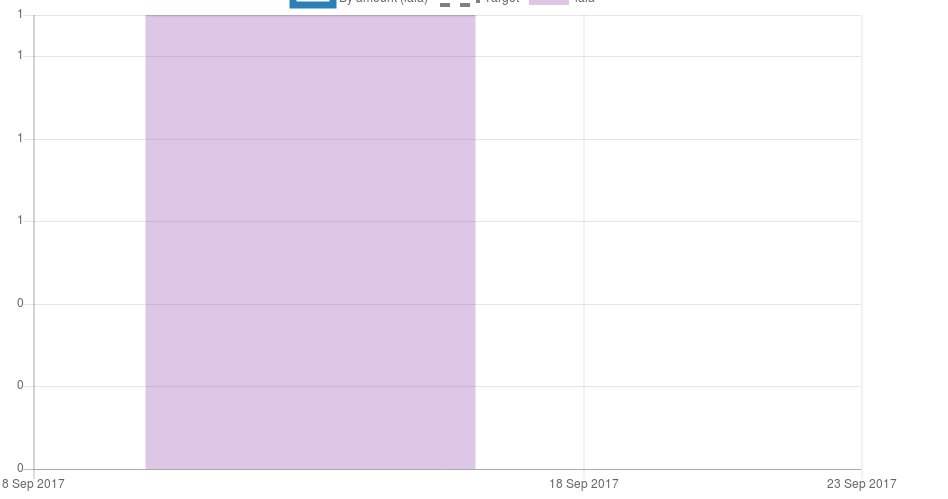
See Y axis? This is caused because we are returning rounded value in options.yAxes.ticks.callback. So chart.js calls callback with 0, 0.1 ... 0.9, 1.0, 1.1 values, but callback returns 0, 1 only. Repeating same values in a chart is undesirable for end user.
In userspace, I've applied following fix to solve this issue:
// this is to prevent repeating tick values
var middlewareToMakeTicksUnique = function(next) {
    return function(value, index, values) {
        var nextValue = next(value);

        if (index && values.length > index+1 && // always show first and last tick
            // don't show if next or previous tick is same
            (next(values[index + 1]) === nextValue || next(values[index - 1]) === nextValue)
        ) {
            return null;
        }

        return nextValue;
    }
};

...

yAxes: [{
    ticks: {
        callback: middlewareToMakeTicksUnique(function (value) {
            return value.format();
        })
    }
}]
 ostrolucky
All 16 comments
@ostrolucky do you have a fiddle that reproduces this?
 etimberg
on 12 Sep 2017
ostrolucky
on 13 Sep 2017
etimberg
on 12 Sep 2017
ostrolucky
on 13 Sep 2017
I'm not entirely convinced this is a bug. The callback is explicitly formatting the string values for ticks like 0.8 to be 1 and so 1 is displayed. The conversion to strings happens after all the ticks have been calculated.
Using a callback to only display certain ticks is recommended. Here I've written a simple one that only returns ticks that are integers and removes the others. If you want grid lines to show up for the hidden ticks, return '' instead of null.
etimberg
on 17 Sep 2017
I don't care about classification of this, I never mentioned it's a bug. I don't see current behaviour as sensible though. I don't see any use case where it's useful when values shown there are duplicated, do you? I also don't see why is developer forced to work around this. Developer never provided non-integer value, but Chart.js tries to display them. I've never see this in other charting solutions.
ostrolucky
on 17 Sep 2017
Closing as this is unlikely to be fixed.
ostrolucky
on 19 Sep 2017
@etimberg same here. I need to format ticks' value with different units, this solution couldn't help.
Can this issue be reopened please?
 sstruct
on 8 Nov 2017
sstruct
on 8 Nov 2017
Worked out a temporary solution:
ticks: {
  beginAtZero: true,
  // formatValue convert value to be suffixed, eg: 0.2 -> 20%
  callback: value => formatValue(value),
  /**
   * userCallback
   * @param label
   * @param index
   * @param labels
   * @return {*}
   */
  userCallback: (label, index, labels) => {
    // _ refers to [lodash](https://lodash.com/)
    if ((_.every(labels, lb => Math.abs(lb) < 1) && Math.floor(label * 100) === label.toFixed(4) * 100)
          || Math.floor(label) === label
          || index === 0) {
      return formatValue(label);
    }
  },
},
ref: https://stackoverflow.com/questions/37699485/skip-decimal-points-on-y-axis-in-chartjs
Another Solution Now:
/**
 * fix issue: https://trello.com/c/7MeGZsmu
 * @param label
 * @param index
 * @param labels
 * @return {*}
 */
userCallback: function(label, index, labels) {
  const formatedLabel = formatValue(label, unitDesc);
  const formatedLabels = _.map(labels, lb => formatValue(lb, unitDesc));
  const counts = _.countBy(formatedLabels);
  if (counts[formatedLabel] === 1
    || index === labels.length - 1
    || index === 0) {
    return formatedLabel;
  }
},
Since I see other people have same problem, reopening
ostrolucky
on 17 Nov 2017
It'd be great if this would be fixed soon
 sabelofficial
on 17 Nov 2017
sabelofficial
on 17 Nov 2017
There is a proposal to add a way of forcing integer steps in https://github.com/chartjs/Chart.js/pull/4841
etimberg
on 17 Nov 2017
Closing as this was solved in #4841 and is already available in version 2.7.3 (setting ticks.precision to 0, no need for callback).
 nagix
on 24 Dec 2018
nagix
on 24 Dec 2018
Using precision: 0 (or even { precision: 0, integerSteps: true }) and still have repeating tick values, as described above
version 2.7.3
 pimvanderheijden
on 31 Jan 2019
pimvanderheijden
on 31 Jan 2019
I got it working now. What helped was converting the (y) values first, before constructing a label in ticks.callback . Appears to me that Chart.js does filter identical values only before the callback and not after.
pimvanderheijden
on 1 Feb 2019
I got the solution by using suggestedMin, suggestedMax, and stepSize
https://www.chartjs.org/docs/latest/axes/cartesian/linear.html#axis-range-settings
 eakkew
on 8 Feb 2019
eakkew
on 8 Feb 2019
Repeating values are not seen in graph any one who has resolved it please send the 'options' of chart
 JIGARKAPADIYA
on 7 May 2020
JIGARKAPADIYA
on 7 May 2020
I was struggling with this problem for hours at last "precision: 0" solved this for me.
options: {
        scales: {
            yAxes: [{
                ticks: {
                    beginAtZero: false,
                    fontSize: 20,
                    precision:0
                }
            }]
    }
}
 tapivideos
on 17 Dec 2020
tapivideos
on 17 Dec 2020
Related issues
 Woogles
·
3Comments
Woogles
·
3Comments
 gouthamrv
·
3Comments
gouthamrv
·
3Comments
 benmccann
·
3Comments
benmccann
·
3Comments
 gabrieldesouza
·
3Comments
gabrieldesouza
·
3Comments
 adriantombu
·
3Comments
adriantombu
·
3Comments
Most helpful comment
Closing as this was solved in #4841 and is already available in version 2.7.3 (setting
ticks.precisionto0, no need forcallback).