Chart.js: Logarithmic axes do not respect maxTicksLimit
Expected Behavior
Only the number of tick lines specified should show, or at least something readable should render.
Current Behavior
Every increment of 1eX, 2eX, and 5ex are shown between the min and max. This can be exceptionally hard to read.
The codepen linked below shows the issue, but using my actual data which has a much larger range the axis looks even worse.
Possible Solution
Don't allow the logarithmic ticks to be so close together.
Based on the current behavior, it seems that 1eX, 2eX, and 5ex are always shown on the grid, no matter the range.
it seems like if the numbers are that large, basically only the exponent should be considered. For example, if the values are 1e1, 1e2, 1e3, ..., 1e100, the axis ticks would be similar to a linear graph with points 1, 2, 3, ..., 100.
Steps to Reproduce (for bugs)
https://codepen.io/anon/pen/dzrPzO
Context
I'm unable to use chart.js because of this bug as I'm plotting only logarithmic graphs.
Environment
- Chart.js version: 2.6.0
- Browser name and version: Chrome
- Link to your project: N/A, See codepen link above for details
 dfederm
All 5 comments
I was hacking around just to see if I could give a hint toward the solution and found a potentially starting point at least.
In core.ticks.js, the logarithmic function could be changed to something like:
logarithmic: function (generationOptions, dataRange) {
dataRange.min = helpers.log10(dataRange.min);
dataRange.max = helpers.log10(dataRange.max);
generationOptions.maxTicks = 11; // should get this from the tick options, which are not fully provided in the generationOptions
var ticks = Chart.Ticks.generators.linear(generationOptions, dataRange);
for (var i = 0; i < ticks.length; i++) {
ticks[i] = Math.pow(10, ticks[i]);
}
return ticks;
}
The maxTicks is a clear example of not providing the proper options to this function from scale.logarithmic.js, and I'm sure there are more options that would need to be handled, for example stepSize, min, max to name a few used in the linear function`.
This changes my example above to look like this instead though, which is more or less what I was wanting:

dfederm
on 3 Sep 2017
@dfederm I agree that the default tick formatter code could be improved on. You could obtain the result you've described by overriding the default ticks callback by setting ticks.userCallback example.
The formatter function in the example accepts a new option ticks.labels, in which you are able to config which ticks should be displayed and if empty gridlines should be display or not.
labels: {
  index:  ['min', 'max'], // Show ticks for min and max value, or whatever numeric index
  significand:  [1], // Show ticks with significand number, default [1, 2, 5]
  removeEmptyLines: true // hide empty gridlines, default is false
}
var helpers = Chart.helpers;
/* logarithmic formatter function */
var logarithmicFormatter = function(tickValue, index, ticks) {
    var me = this;
    var labelOpts =  me.options.ticks.labels || {};
    var labelIndex = labelOpts.index || ['min', 'max'];
    var labelSignificand = labelOpts.significand || [1, 2, 5];
    var significand = tickValue / (Math.pow(10, Math.floor(helpers.log10(tickValue))));
    var emptyTick = labelOpts.removeEmptyLines === true ? undefined : '';
    var namedIndex = '';

    if (index === 0) {
        namedIndex = 'min';
    } else if (index === ticks.length - 1) {
        namedIndex = 'max';
    }

    if (labelOpts === 'all'
        || labelSignificand.indexOf(significand) !== -1
        || labelIndex.indexOf(index) !== -1
        || labelIndex.indexOf(namedIndex) !== -1
    ) {
        if (tickValue === 0) {
            return '0';
        } else {
            return tickValue.toExponential();
        }
    }
    return emptyTick;
};
var ctx = document.getElementById("myChart");
var myChart = new Chart(ctx, {
    type: 'line',
    data: {
        labels: ["Red", "Blue", "Yellow", "Green", "Purple", "Orange"],
        datasets: [
          {
            label: 'dataset 1',
            data: [1e12, 1e19, 1e3, 1e5, 1e2, 1e3]
          },
          {
            label: 'dataset 2',
            data: [1e0, 1e1, 1e2, 1e1, 1e1, 1e1]
          }
        ]
    },
    options: {
        scales: {
            yAxes: [{
                type: "logarithmic",
                ticks: {
                    labels: {
                        index:  ['min', 'max'],
                        significand:  [1],
                        removeEmptyLines: true,
                    },
                    userCallback: logarithmicFormatter
                }
            }]
        }
    }
});
 jcopperfield
on 20 Dec 2017
jcopperfield
on 20 Dec 2017
I'm sorry to comment on an old issue, but I wanted to say thanks to @jcopperfield ! That fix worked amazingly.
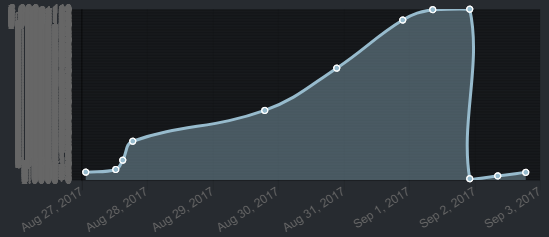
It went from this (this case wasn't even the worst):

To this:

I'm using react-chartjs-2 2.7.4 and chart.js 2.7.2
 Naahuel
on 31 Jul 2018
Naahuel
on 31 Jul 2018
Thanks @jcopperfield !
 alx
on 15 Jan 2019
alx
on 15 Jan 2019
This has been fixed in v3: https://codepen.io/kurkle/pen/mdrPbKr
 kurkle
on 4 Dec 2020
kurkle
on 4 Dec 2020
Related issues
 akashrajkn
·
3Comments
akashrajkn
·
3Comments
 lbowers
·
3Comments
lbowers
·
3Comments
 HeinPauwelyn
·
3Comments
HeinPauwelyn
·
3Comments
 SylarRuby
·
3Comments
SylarRuby
·
3Comments
 lizbanach
·
3Comments
lizbanach
·
3Comments
Most helpful comment
@dfederm I agree that the default tick formatter code could be improved on. You could obtain the result you've described by overriding the default ticks callback by setting
ticks.userCallbackexample.The formatter function in the example accepts a new option
ticks.labels, in which you are able to config which ticks should be displayed and if empty gridlines should be display or not.