Chart.js: Feature: Make ranges for tick auto generation configurable
This is against master (with or without #4545)- notice the Q3 in the _middle_ of the year as well as the thicker first gridline:
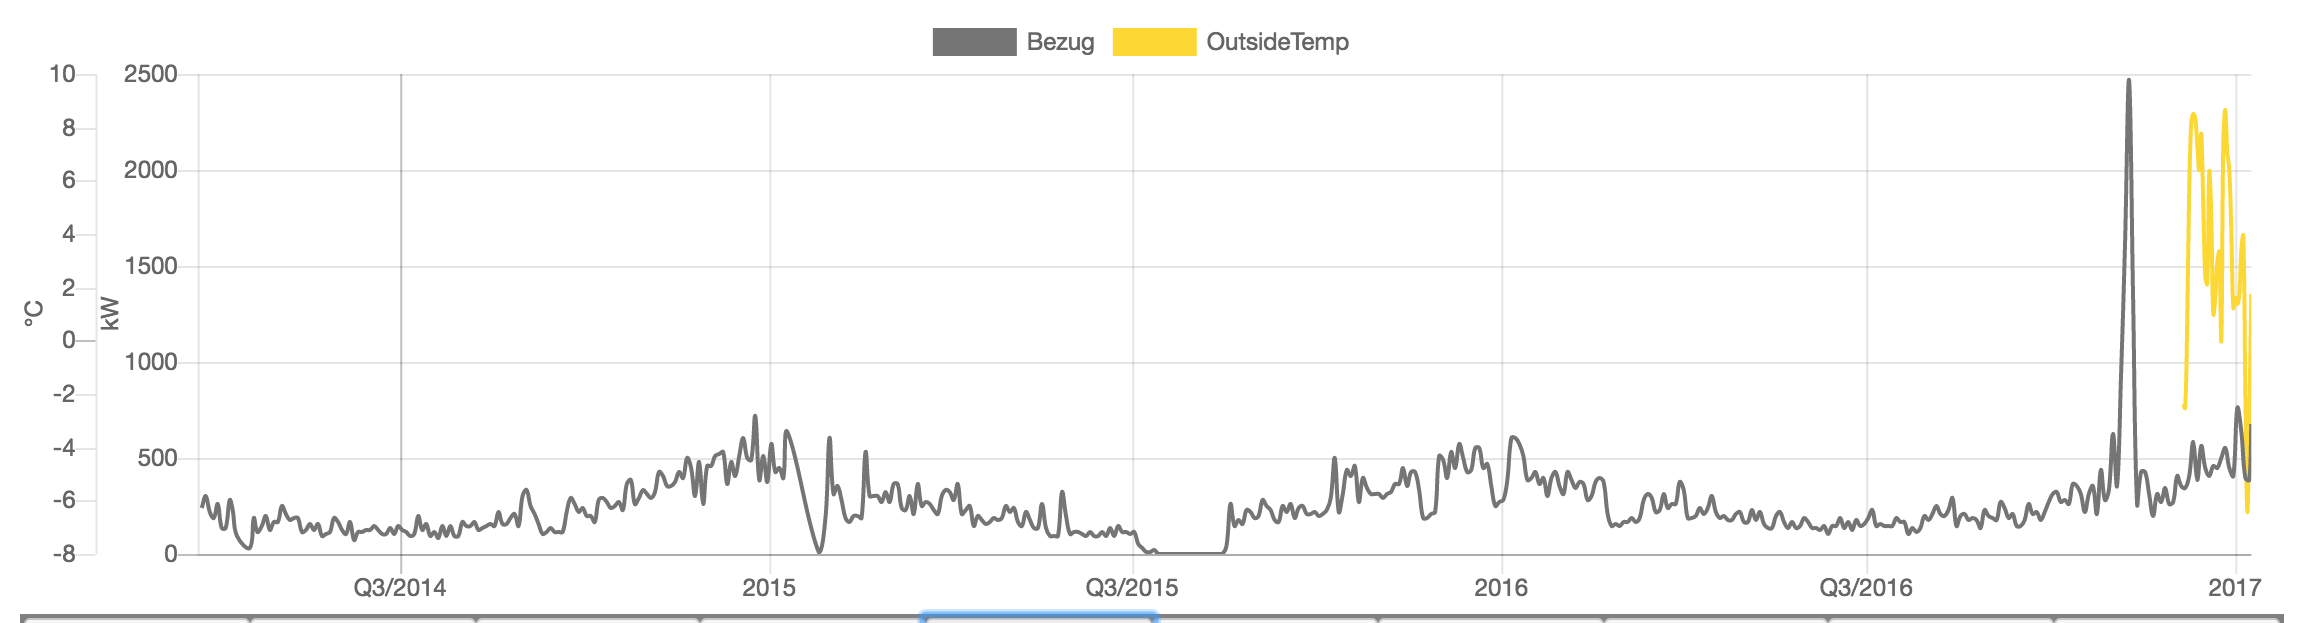
Here's the associated fiddle: http://jsfiddle.net/andig2/sexq35rn/2/
Looks like an issue with determiniNotice that depends on width of the chart. Maybe the behaviour should already be addressed by any of the open PRs?
 andig
andig
All 13 comments
The ticker first grid line should be fixed in #4545, I don't know about the Q3 positioning
 simonbrunel
on 11 Aug 2017
simonbrunel
on 11 Aug 2017
Not fixed by #4545, just retested :(
andig
on 11 Aug 2017
You right, #4545 fixed it only for the case of options.offset === gridLines.offsetGridLines
simonbrunel
on 11 Aug 2017
Might be fixed by #4117 then :) (@Zamaroth is about to rewrite it)
simonbrunel
on 11 Aug 2017
4117 seems to take care of the line formatting: http://jsfiddle.net/andig2/vLgosao7/ but introduces two new problems (I can migrate this comment there):
- gridline formatting is bc break with current implementation (y axes in the example), this might be fixable by looking at the docs
- doesn't respect min/max settings on the x axis
andig
on 11 Aug 2017
the implementation is gonna change and I can assure you it's gonna enable you to change the look of the first horizontal gridLine
 Zamaroth
on 11 Aug 2017
Zamaroth
on 11 Aug 2017
I don't know about the Q3 positioning
Figured that one out. Its actually correct- middle of the year is the start of the third quarter. It just looks very weird, more so since q2 and q4 are not displayed. Imho this "quarter style" default formatting is more confusing than helpful?
andig
on 12 Aug 2017
ping @simonbrunel
andig
on 16 Aug 2017
@andig we should maybe provide a way to customize the available ranges for tick auto generation.
simonbrunel
on 17 Aug 2017
Sounds like a good idea, updated title
andig
on 17 Aug 2017
The first gridline problem is btw also noticable in the time scale point data example.
andig
on 21 Aug 2017
Thicker first grid line - Fixed by #4700.
Quater style labels - Fixed by #4777 skipping quarters and weeks during the auto tick generation. Because this fiddle is using the master build, now you will see ticks at a 3-month interval with Mar, Jun, Sep and Dec when you make the window larger. If ticks.major.enabled is set to true, ticks will be aligned to the beginning of year like 2015, Apr, Jul and Oct.
 nagix
on 24 May 2019
nagix
on 24 May 2019
If
ticks.major.enabledis set to true, ticks will be aligned to the begging of year like 2015, Apr, Jul and Oct.
This is somewhat true today. It will align the first major label. To align all of them we need https://github.com/chartjs/Chart.js/pull/6274
 benmccann
on 24 May 2019
benmccann
on 24 May 2019
Related issues
 Woogles
·
3Comments
Woogles
·
3Comments
 HeinPauwelyn
·
3Comments
HeinPauwelyn
·
3Comments
 srijitcoder
·
3Comments
srijitcoder
·
3Comments
 gabrieldesouza
·
3Comments
gabrieldesouza
·
3Comments
 bytesnz
·
3Comments
bytesnz
·
3Comments