Chart.js: Line Chart - line on the edge get cut
Expected Behavior
line chart to display the whole line with same width
Current Behavior
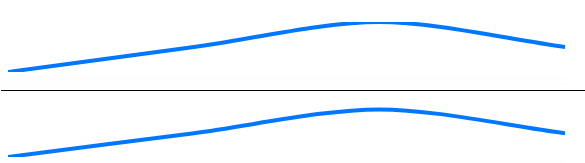
seems line chart displays a 1 px line on the top and bottom in chart.js 2.5
Possible Solution
Steps to Reproduce (for bugs)
example of the issue (chart.js 2.5) can be found in https://jsfiddle.net/e8n4xd4z/118/, both top and bottom width are thinner than expected.
previous version (chart.js 2.4) is working fine https://jsfiddle.net/e8n4xd4z/117/,
Context
Environment
- Chart.js version: 2.5
- Browser name and version: Chrome 55, IE 10
- Link to your project:https://jsfiddle.net/e8n4xd4z/118
 showenx
All 29 comments
The problem here is the clipping that is implemented for points outside the chart area. I think we can just add the lineWidth/2 to the edges here https://github.com/chartjs/Chart.js/blob/master/src/controllers/controller.line.js#L288 instead of passing area directly but that could cause other problems.
I'm happy to look at a PR for this but I can guarantee that we could merge anything since it would break other cases. As a workaround, just make the top of the y axis a bit higher so that the line isn't at the edge of the chart
 etimberg
on 1 May 2017
etimberg
on 1 May 2017
thanks for the quick response, the work around is working fine on max values: https://jsfiddle.net/e8n4xd4z/119/
any suggestions on the min values? if we don't want to see minus on yAxes
showenx
on 1 May 2017
this bug not fixed yet in 2.6 ?
 golpesareirooni
on 14 Jul 2017
golpesareirooni
on 14 Jul 2017
Not yet. I hope this will be fixed in 2.7.
 nyammy
on 10 Sep 2017
nyammy
on 10 Sep 2017
This seems to be fixed in 2.7.0.
Thank you developers.
nyammy
on 21 Sep 2017
Unfortunately, the issue is still there for 2.7.0 Here is an example https://jsfiddle.net/fakiolinho/m5xoa7jq/7/. I get we can tackle it for max values but i cannot figure out how to overcome this for min ones:

 fakiolinho
on 2 Oct 2017
fakiolinho
on 2 Oct 2017
the line seems working fine in v2.4 https://jsfiddle.net/e8n4xd4z/1008/
maybe restate back the changes?
showenx
on 3 Oct 2017
Hmm, yeah I used also v2.4 in my example and lines look pretty solid over there

fakiolinho
on 3 Oct 2017
On my observation - the issue is reproducible only when max data value is an integer value(1,2...10... ). If max is float (e.g 10.1) - no cut and some extra tick is added - which is fine
P.S. even more precise - reproduces when integer is division of 10 and values in range 1-9 (e.g 1,2,3,...10,20..60,100,340 ...)
 eugeneJava
on 4 Oct 2017
eugeneJava
on 4 Oct 2017
And also it reproducible when a chart contains a title
eugeneJava
on 9 Nov 2017
I'm experiencing this issue with 2.7.1, when I have lines at the min and max.
 chdsbd
on 2 Dec 2017
chdsbd
on 2 Dec 2017
@chandruxp same here. I also tried the master branch. Any reliable workaround you have found?
 jacktuck
on 30 Jan 2018
jacktuck
on 30 Jan 2018
I am also having the same issue when the points are at min or max. Also same thing happens when the points are close to min or max and the range is high

.
 GihanWijesingheCreative
on 2 Feb 2018
GihanWijesingheCreative
on 2 Feb 2018
I'm experiencing the same issue with scatter points - they just don't show up when they are at the max value (although they do show up fine when they are at the min value).
 andrewcallahan
on 10 Feb 2018
andrewcallahan
on 10 Feb 2018
Any update / fix for this? Still experiencing this issue with version 2.7.2, and i'm not able to find a decent solution.
 stigvanbrabant
on 9 Mar 2018
stigvanbrabant
on 9 Mar 2018
@StigVanbrabant We just use 2.4 for now as there is no other workaround
jacktuck
on 9 Mar 2018
Looks like the 2.72 update solved this issue for scatter points at the max value
andrewcallahan
on 11 Mar 2018
We're on 2.7.2 and the max values are still a thin line. :(

 hanspagel
on 19 Mar 2018
hanspagel
on 19 Mar 2018
Here's how I fixed it:
            ticks: {
              beginAtZero: false,
              min: 0,
              max: 5.03,
              stepSize: 1,
              padding: 10,
              fontFamily: 'Karla, sans-serif',
              maxRotation: 0,
              callback: function(value, index, values) {
                if (value !== 5.03) {
                  return values[index]
                }
              }
            },
slightly increase the max and then omit it in the callback otherwise you get slightly offset duplicate top lines
 atomkirk
on 12 Apr 2018
atomkirk
on 12 Apr 2018
Problem still persists:
Options:
scales: {
    yAxes: [{
        id: 'y-axis-1',
        type: 'linear',
        display: false,
        position: 'left',
        ticks: {
            beginAtZero: true,
            max: 30
        }
    }],
    xAxes: [{
        gridLines: {
            display: false,
            borderDash: [8, 4],
            color: "#fff"
        }
    }]
},
elements: {
    line: {
        tension: 0.5, // disables bezier curves
    },
    point: {
        radius: 3
    }
},
maintainAspectRatio: false,
 cylosh
on 19 May 2018
cylosh
on 19 May 2018
I'm currently facing the same issue as well.
 mikekok
on 29 May 2018
mikekok
on 29 May 2018
Fixed in master by #5321 (https://jsfiddle.net/e8n4xd4z/8951/) and will be released in 2.7.3 or 2.8.
 simonbrunel
on 29 May 2018
simonbrunel
on 29 May 2018
Still happening when no legend nor title are included:

My workaround to fix it was to add an empty title an remove all spacing minus a 1px padding:
title: {
  display: true,
  lineHeight: 0,
  padding: 1,
}

 rudeayelo
on 4 Jul 2018
rudeayelo
on 4 Jul 2018
When will 2.7.3 or 2.8 be released? I am still having this issue. Thanks!
 villamil
on 5 Sep 2018
villamil
on 5 Sep 2018
Same issue using 2.7.2
I fixed my issue by making max tick greater than highest value in data.
ex. data: [1,3,2,1];
yAxes:[{
         ticks:{
            max:3.1 //or 4 if you want
          },
}]
 h4rDkur
on 10 Sep 2018
h4rDkur
on 10 Sep 2018
This fix has been included and released in 2.7.3.
Note that you still need to add padding using the layout.padding option to keep the line from being cut if no legend, title or ticks are displayed.
options: {
    layout: {
        padding: {
            top: 1.5 // half border width
        }
    }
}
 nagix
on 23 Oct 2018
nagix
on 23 Oct 2018
I'm on 2.7.3 and still getting this issue in two places.
1) Lines and points being cut off (I have the axis set to automatically determine a max point based on the data maximum)

2) Annotations being cut off https://github.com/chartjs/chartjs-plugin-annotation

I have tried setting a blank title, and also tried adding layout padding to the top, as suggested above. Neither worked.
Proof I'm on 2.7.3.......

 Techn1x
on 23 Nov 2018
Techn1x
on 23 Nov 2018
Also my problem https://github.com/chartjs/Chart.js/issues/4202#issuecomment-390355971 was not fixed by upgrading to 2.7.3, even with the layout.padding set I´m hitting the same issue as before.
cylosh
on 23 Nov 2018
Here's how I fixed it:
            ticks: {
              beginAtZero: false,
              min: 0,
              max: 5.03,
              stepSize: 1,
              padding: 10,
              fontFamily: 'Karla, sans-serif',
              maxRotation: 0,
              callback: function(value, index, values) {
                if (value !== 5.03) {
                  return values[index]
                }
              }
            },
slightly increase the
maxand then omit it in the callback otherwise you get slightly offset duplicate top lines
Your method work properly and it working on every version. just need to use max value + 1
Thanks
 shivsingh7150
on 9 Aug 2019
shivsingh7150
on 9 Aug 2019
Related issues
 nanospeck
·
3Comments
nanospeck
·
3Comments
 gouthamrv
·
3Comments
gouthamrv
·
3Comments
 srijitcoder
·
3Comments
srijitcoder
·
3Comments
 bytesnz
·
3Comments
bytesnz
·
3Comments
 SylarRuby
·
3Comments
SylarRuby
·
3Comments
Most helpful comment
Fixed in master by #5321 (https://jsfiddle.net/e8n4xd4z/8951/) and will be released in 2.7.3 or 2.8.