Chart.js: Horizontal Bars mix with lines
Expected Behavior
Horizontal Bars mix with line
Current Behavior
I have vertical bar with mix line chart, when it changes the type to horizontal bar the other dataset desapear
 joaofiliperocha
All 14 comments
@joaofiliperocha do you have a test case that reproduces this issue?
 etimberg
on 1 Apr 2017
etimberg
on 1 Apr 2017
I also want to draw a horizontal bar chart mixed with a line chart, using data like this:
week, bar, line
Monday, 1, 10
Tuesday, 2, 20
Wednesday, 3, 30
Thursday, 4, 40
Friday, 5, 50
Saturday, 6, 60
Sunday, 7, 70
could you please help with a sample code? Thanks.
 lwlwlwlw
on 1 Apr 2017
lwlwlwlw
on 1 Apr 2017
@joaofiliperocha. I think that you can't plot a line chart mixed with a horizontalBar, because we don't have an "horizontalLine" chart type. @lwlwlwlw Try this sample. @etimberg
 rafaelCMoura
on 5 Apr 2017
rafaelCMoura
on 5 Apr 2017
+1
 fdefelici
on 6 Apr 2017
fdefelici
on 6 Apr 2017
I found this .. hope it helps
joaofiliperocha
on 26 Apr 2017
Ok @joaofiliperocha, to make this with Chart.js see this:
http://stackoverflow.com/questions/30256695/chart-js-drawing-an-arbitrary-vertical-line
rafaelCMoura
on 26 Apr 2017
Here is a codepen that demonstrates the issue, if that is useful:
 johnpitchko
on 18 Aug 2017
johnpitchko
on 18 Aug 2017
@etimberg So is this ever going to be supported? The website advertises Mixed charts... that gives the impression you can mix more then a handful of predefined mixes
 EpicKip
on 15 Dec 2017
EpicKip
on 15 Dec 2017
It would be a great thing to have vertical lines, too
 weberhofer
on 1 Aug 2018
weberhofer
on 1 Aug 2018
mixed chart still doesn't support horizontalBar + line yet?
 jetfontanilla
on 8 Aug 2018
jetfontanilla
on 8 Aug 2018
No, verticalLines would be required, but there are none.
weberhofer
on 9 Aug 2018
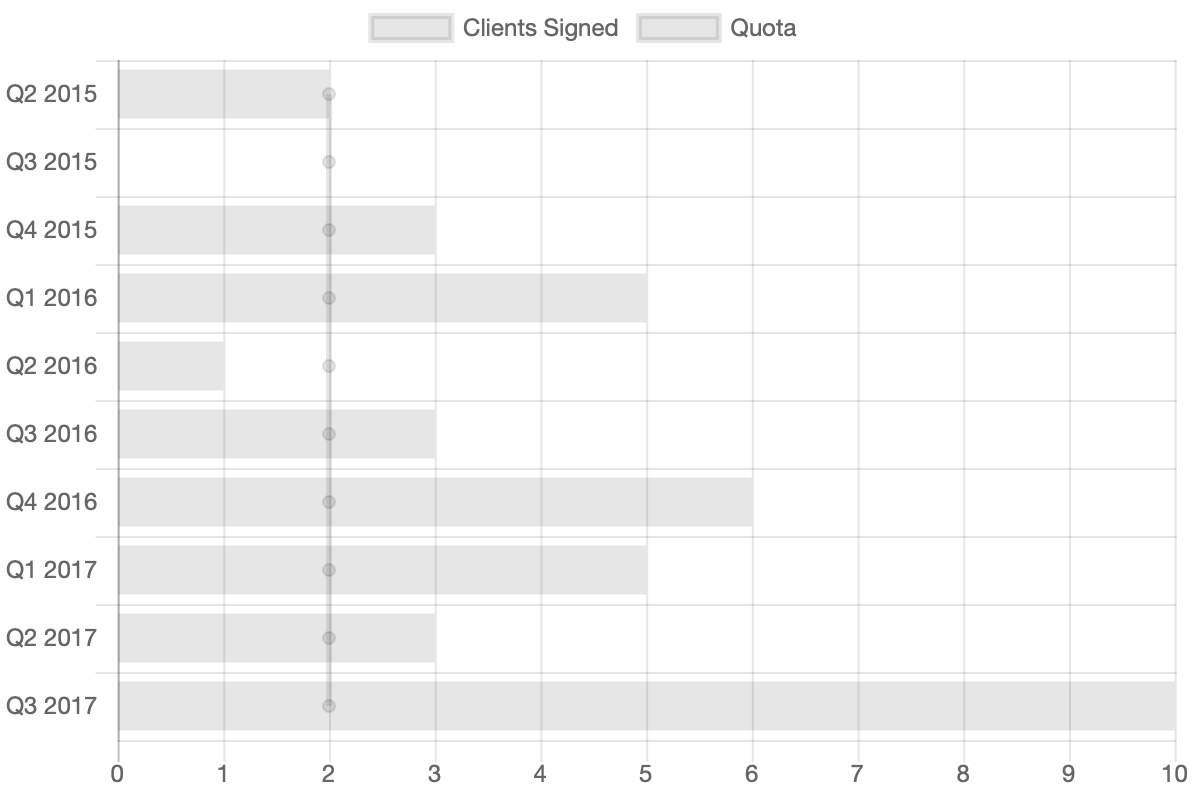
If you use {x: 1, y: 'label'} format for lines, they will be drawn. Try to replace the following part in https://codepen.io/johnpitchko/pen/OjzGrr.
data: {
  datasets: [{
    label: "Clients Signed",
    data: [2, 0, 3, 5, 1, 3, 6, 5, 3, 10]
  }, {
    label: 'Quota',
    data: [{x: 2, y: 'Q2 2015'}, {x: 2, y: 'Q3 2015'}, {x: 2, y: 'Q4 2015'}, {x: 2, y: 'Q1 2016'}, {x: 2, y: 'Q2 2016'}, {x: 2, y: 'Q3 2016'}, {x: 2, y: 'Q4 2016'}, {x: 2, y: 'Q1 2017'}, {x: 2, y: 'Q2 2017'}, {x: 2, y: 'Q3 2017'}],
    type: 'line'
  }],
  labels: ['Q2 2015', 'Q3 2015', 'Q4 2015', 'Q1 2016', 'Q2 2016', 'Q3 2016', 'Q4 2016', 'Q1 2017', 'Q2 2017', 'Q3 2017']
}
 nagix
on 1 Nov 2018
nagix
on 1 Nov 2018
What's the status of this, seems that the work-a-round (https://codepen.io/johnpitchko/pen/OjzGrr.) is not working anymore?
 wuahi
on 7 Dec 2018
wuahi
on 7 Dec 2018
@wuahi That one was never working, look at the post above you. You still have to replace it :) The trick for lines is this part:
data: [{x: 2, y: 'Q2 2015'}, {x: 2, y: 'Q3 2015'}, {x: 2, y: 'Q4 2015'}, {x: 2, y: 'Q1 2016'}, {x: 2, y: 'Q2 2016'}, {x: 2, y: 'Q3 2016'}, {x: 2, y: 'Q4 2016'}, {x: 2, y: 'Q1 2017'}, {x: 2, y: 'Q2 2017'}, {x: 2, y: 'Q3 2017'}],
instead of just giving a value, you're giving an object with x as the value and y the label
EpicKip
on 7 Dec 2018
Related issues
 adriantombu
·
3Comments
adriantombu
·
3Comments
 nanospeck
·
3Comments
nanospeck
·
3Comments
 kennsippell
·
3Comments
kennsippell
·
3Comments
 Woogles
·
3Comments
Woogles
·
3Comments
 frlinw
·
3Comments
frlinw
·
3Comments
Most helpful comment
If you use
{x: 1, y: 'label'}format for lines, they will be drawn. Try to replace the following part in https://codepen.io/johnpitchko/pen/OjzGrr.