Chart.js: Possibility for adding multiple label-arrays for multiple dataset doughnut diagrams
When creating a doughnut diagram with multiple rings there seems to be no option for adding different arrays of labels. One array for each dataset. For example in this chart a option, so every item has it's color name as label (tooltip):
  var ctx = $("#myChart");
  var myChart = new Chart(ctx, {
  type: 'doughnut',
      data: {
          labels: ["Green", "Yellow", "Red", "Purple", "Blue"],
          datasets: [
            {
              data: [1,2,3,4,5],
              backgroundColor: [
                  'green',
                  'yellow',
                  'red',
                  'purple',
                  'blue',
              ],
            },
            {
              data: [6,7,8],
              backgroundColor: [
                  'black',
                  'grey',
                  'lightgrey'
              ],
            },
          ]
      },
  options: {
    responsive: true,
    legend: {
      display: false,
    }
  }
  });
 Mrfuyu
All 6 comments
I think you might be able to do this by changing the config function that generates the labels. I will try and prototype something out
 etimberg
on 24 Feb 2017
etimberg
on 24 Feb 2017
Adding some extra data to the datasets and then changing the tooltip label callback works: https://jsfiddle.net/moe2ggrd/1/
etimberg
on 24 Feb 2017
Hope you don't mind, I'm just going to copy the code out of that fiddle and paste it here in case it disappears since it's really useful!
var ctx = $("#myChart");
var myChart = new Chart(ctx, {
    type: 'doughnut',
    data: {
        datasets: [{
            data: [1, 2, 3, 4, 5],
            backgroundColor: [
                'green',
                'yellow',
                'red',
                'purple',
                'blue',
            ],
            labels: [
                'green',
                'yellow',
                'red',
                'purple',
                'blue',
            ]
        }, {
            data: [6, 7, 8],
            backgroundColor: [
                'black',
                'grey',
                'lightgrey'
            ],
            labels: [
                'black',
                'grey',
                'lightgrey'
            ],
        },]
    },
    options: {
        responsive: true,
        legend: {
            display: false,
        },
        tooltips: {
            callbacks: {
                label: function(tooltipItem, data) {
                    var dataset = data.datasets[tooltipItem.datasetIndex];
                    var index = tooltipItem.index;
                    return dataset.labels[index] + ': ' + dataset.data[index];
                }
            }
        }
    }
});
 mnpenner
on 1 Oct 2017
mnpenner
on 1 Oct 2017
Great! One issue tough... Is it not possible to display as legend each label attributed to each data?
 LucasBSC
on 30 Aug 2018
LucasBSC
on 30 Aug 2018
It seems the legend displays labels from the first dataset. You could add another dataset, place it first in the dataset array, set its weight: 0. Use this dataset to control what will appear in the legend, and having weight: 0 will not display it with your other datasets in the graph itself.
var ctx = $("#myChart");
var myChart = new Chart(ctx, {
    type: 'doughnut',
    data: {
        datasets: [{
            weight: 0;
            data: [1, 2, 3, 4, 5, 6, 7, 8],
            backgroundColor: [
                'green',
                'yellow',
                'red',
                'purple',
                'blue',
                'black',
                'grey',
                'lightgrey'
            ],
            labels: [
                'green',
                'yellow',
                'red',
                'purple',
                'blue',
                'black',
                'grey',
                'lightgrey'
            ]
        }, {
            weight: 50;
            data: [1, 2, 3, 4, 5],
            backgroundColor: [
                'green',
                'yellow',
                'red',
                'purple',
                'blue',
            ],
            labels: [
                'green',
                'yellow',
                'red',
                'purple',
                'blue',
            ]
        }, {
            weight: 50;
            data: [6, 7, 8],
            backgroundColor: [
                'black',
                'grey',
                'lightgrey'
            ],
            labels: [
                'black',
                'grey',
                'lightgrey'
            ],
        },]
    },
    options: {
        responsive: true,
        legend: {
            display: false,
        },
        tooltips: {
            callbacks: {
                label: function(tooltipItem, data) {
                    var dataset = data.datasets[tooltipItem.datasetIndex];
                    var index = tooltipItem.index;
                    return dataset.labels[index] + ': ' + dataset.data[index];
                }
            }
        }
    }
});
 gboudreau
on 28 Aug 2020
gboudreau
on 28 Aug 2020
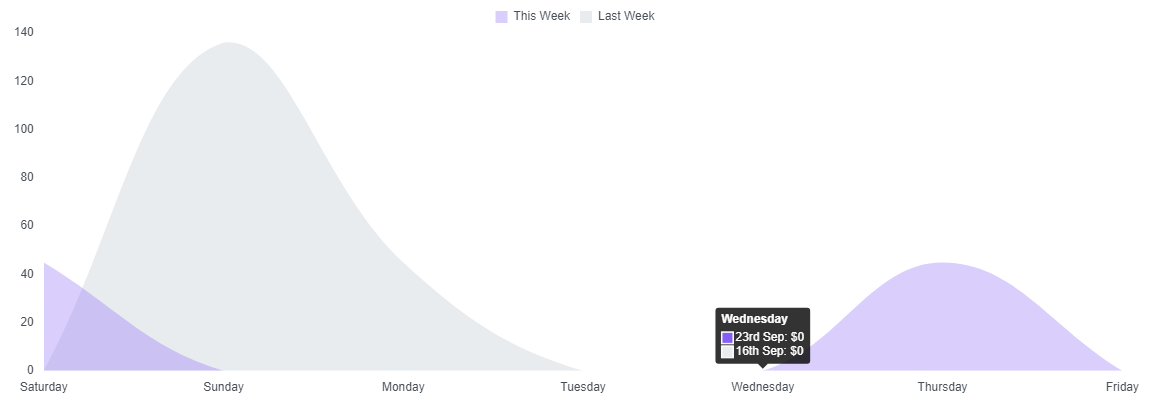
Thank you. It works with line charts as well.
const chartOptions = {
    maintainAspectRatio: false,
    responsive: true,
    tooltips: {
        intersect: false,
        callbacks: {
            label: function(tooltipItem, data) {
                const dataset = data.datasets[tooltipItem.datasetIndex];
                const index = tooltipItem.index;
                return dataset.labels[index] + ': $' + dataset.data[index];
            }
        }
    }
};

const chartData = {
    labels: window.sellerChartData.labelsDayName,
    datasets: [
        {
            label: 'This Week',
            fill: true,
            backgroundColor: 'rgba(132, 94, 247, .3)',
            borderColor: 'transparent',
            pointBackgroundColor: 'rgba(132, 94, 247, 1)',
            pointBorderColor: '#fff',
            pointHoverBackgroundColor: '#fff',
            pointHoverBorderColor: 'rgba(132, 94, 247, 1)',
            data: window.sellerChartData.dataThisWeek,
            labels: window.sellerChartData.labelsThisWeek
        },
        {
            label: 'Last Week',
            fill: true,
            backgroundColor: 'rgba(233, 236, 239, 1)',
            borderColor: 'transparent',
            pointBackgroundColor: 'rgba(233, 236, 239, 1)',
            pointBorderColor: '#fff',
            pointHoverBackgroundColor: '#fff',
            pointHoverBorderColor: 'rgba(233, 236, 239, 1)',
            data: window.sellerChartData.dataLastWeek,
            labels: window.sellerChartData.labelsLastWeek
        }
    ]
};
 JCarlosR
on 25 Sep 2020
JCarlosR
on 25 Sep 2020
Related issues
 Woogles
·
3Comments
Woogles
·
3Comments
 nickgoodliff
·
3Comments
nickgoodliff
·
3Comments
 longboy
·
3Comments
longboy
·
3Comments
 kennsippell
·
3Comments
kennsippell
·
3Comments
 HeinPauwelyn
·
3Comments
HeinPauwelyn
·
3Comments
Most helpful comment
Adding some extra data to the datasets and then changing the tooltip
labelcallback works: https://jsfiddle.net/moe2ggrd/1/