Chart.js: Multiple fill colors for line chart
Hi,
I just want to know if it is possible to have multiple fill color on Line chart that only have one dataset?
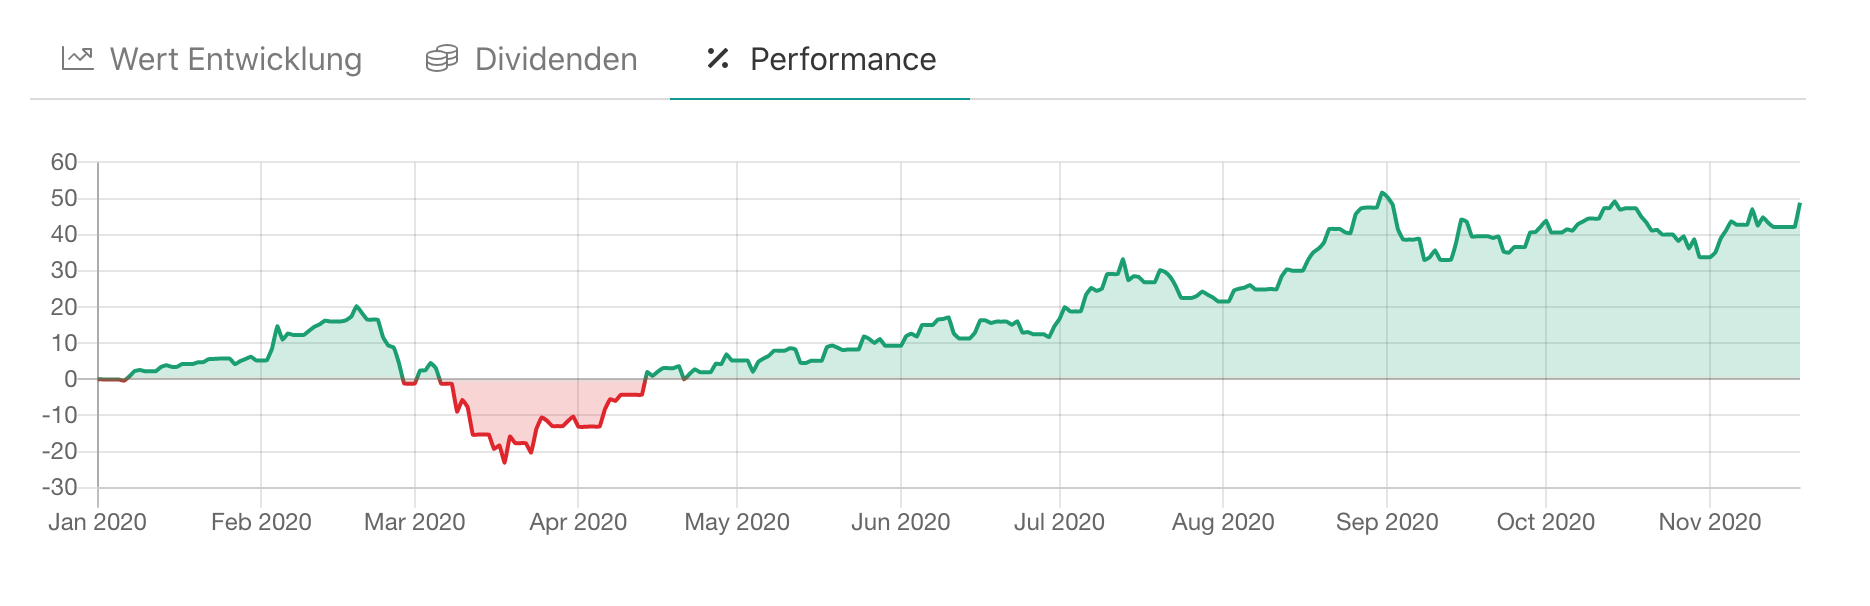
I'm trying to create a line chart that will change the fill color whenever the value on Y-Axis becomes negative.
It should look like this:

I can do multiple colors using 2 datasets but it will look like this:https://jsfiddle.net/mzborromeo/26hbaza4/ which is not what I want. I need only one dataset and all the positive values must have a blue green fill color and negatives will have red fill color. Will it be possible?
Thanks
 mzborromeo
All 11 comments
@mzborromeo unfortunately, you're probably going to have to do this yourself since it requires changes to the line drawing code. You'll need to replace Chart.elements.Line.prototype.draw with something that can do this.
 etimberg
on 1 Aug 2016
etimberg
on 1 Aug 2016
_Food for thought (a bit of a brain dump, sorry) :_
In SVG, it is quite simple to implement using the fill-rule attribute on a path (with some evenodd trickery). If I read the compatibility tables right, the CanvasRenderingContext2D.fill should be able to take a fillrule parameter that does exactly the same.
If that's the case, I may take a look at this.
In my previous charting experiments, I managed to implement the following options :
- Filling different backgrounds when over or below the appropriate x-axis (had to take into account the charts with multiple vertical scales)
- Filling different backgrounds when over or below an arbitrary marker (I don't remember if Chart.js has arbitrary markers, but if so, this mode can be quite useful)
- Filling different backgrounds when over or below another curve (basically, you have to be able to create a inverted path for one of the curves, and append it to the path of the other curve, and it's done)
We then have to find a comprehensive but easy way for the embedder to customize this ^^, If I remember correctly, I designed something like this :
background:
{
fillAgainst: < 'x-axis', marker reference, or serie/dataset reference >,
over: < CSS background value >,
below: < CSS background value >
}
(obviously, in Chart.js case, we would want to accept colors instead of CSS backgrounds)
 MatthieuRivaud
on 8 Aug 2016
MatthieuRivaud
on 8 Aug 2016
@MatthieuRivaud we do support passing a CanvasPattern object as any of the colours. One could make a canvas pattern that fills at the right value (there is even a method on the scale to do this).
I gave @Tarqwyn some direction on this back in the spring and the result was https://github.com/bbc/Chart.Bands.js which might work great in this case
etimberg
on 8 Aug 2016
Closing since the best solution is to create a CanvasGradient and using that as the color.
etimberg
on 16 Oct 2016
Is there an example around how to do that?
 kerner1000
on 6 Nov 2017
kerner1000
on 6 Nov 2017
Found a way. In this example I'm using the option fill: 'origin' on my dataset:
plugins: [{
beforeRender: function (c, options) {
var dataset = c.data.datasets[0];
var yScale = c.scales['y-axis-0'];
var yPos = yScale.getPixelForValue(0);
var gradientFill = c.ctx.createLinearGradient(0, 0, 0, c.height);
gradientFill.addColorStop(0, window.myColors.green);
gradientFill.addColorStop(yPos / c.height - 0.01, window.myColors.green);
gradientFill.addColorStop(yPos / c.height + 0.01, window.myColors.red);
gradientFill.addColorStop(1, window.myColors.red);
var model = c.data.datasets[0]._meta[Object.keys(dataset._meta)[0]].$filler.el._model;
model.backgroundColor = gradientFill;
}
}]
 beroso
on 7 Mar 2018
beroso
on 7 Mar 2018
berosoboy code wasn't working for me on chart.js 2.5.0, I had to change it for:
plugins: [{
        beforeRender: function (x, options) {
                var c = x.chart
            var dataset = x.data.datasets[0];
            var yScale = x.scales['y-axis-0'];
            var yPos = yScale.getPixelForValue(0);

            var gradientFill = c.ctx.createLinearGradient(0, 0, 0, c.height);
            gradientFill.addColorStop(0, 'green');
            gradientFill.addColorStop(yPos / c.height - 0.01, 'green');
            gradientFill.addColorStop(yPos / c.height + 0.01, 'red');
            gradientFill.addColorStop(1, 'red');

            var model = x.data.datasets[0]._meta[Object.keys(dataset._meta)[0]].dataset._model;
            model.backgroundColor = gradientFill;
        }
    }]
And it seems to be working:

 cesartl
on 31 Oct 2018
cesartl
on 31 Oct 2018
This work PERFECTLY !!!!!!! @cesartl @berosoboy thank you so much !!!
 amarnathsdr
on 7 May 2020
amarnathsdr
on 7 May 2020
@cesartl thanks so much! You just made my charts beautiful
 codeofsumit
on 18 Nov 2020
codeofsumit
on 18 Nov 2020
Chartjs v3 supports this out of the box: https://www.chartjs.org/docs/master/charts/area
 kurkle
on 19 Nov 2020
kurkle
on 19 Nov 2020
@codeofsumit Well done, could you please share your options part?
 coditori
on 19 Dec 2020
coditori
on 19 Dec 2020
Related issues
 nickgoodliff
·
3Comments
nickgoodliff
·
3Comments
 JAIOMP
·
3Comments
JAIOMP
·
3Comments
 adriantombu
·
3Comments
adriantombu
·
3Comments
 SylarRuby
·
3Comments
SylarRuby
·
3Comments
 bytesnz
·
3Comments
bytesnz
·
3Comments
Most helpful comment
berosoboy code wasn't working for me on chart.js 2.5.0, I had to change it for:
And it seems to be working:
https://jsfiddle.net/x4dvotLn/