Chart.js: Some labels on axis's are missing
I'll draw a chart with on the X-axis names of cities. The problem is when I'll draw the chart. The values of the even names are missing _(see the yellow marks on the image below)_.

For this chart I wouldn't have that. Is this a bug or have I miss anything in my code?
 HeinPauwelyn
All 8 comments
The auto skip feature is probably hiding them. There is a setting to turn it off, but i don't recall the exact name
 etimberg
on 18 Jun 2016
etimberg
on 18 Jun 2016
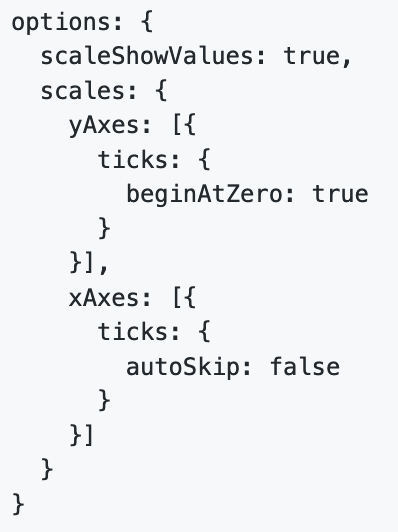
I've found it in the documentation:
scales: {
    xAxes: [{
        stacked: false,
        beginAtZero: true,
        scaleLabel: {
            labelString: 'Month'
        },
        ticks: {
            stepSize: 1,
            min: 0,
            autoSkip: false
        }
    }]
}
In case the previous comment was not clear here is the documentation link:
http://www.chartjs.org/docs/latest/axes/cartesian/#tick-configuration
autoSkip property.
 SherifRefaat
on 3 Oct 2017
SherifRefaat
on 3 Oct 2017
not working for me, even if setting autoskip:false (tried in the ticks options, in the data array...)
 phil123456
on 22 Mar 2018
phil123456
on 22 Mar 2018
This works for me (as an example):
chart.scales["x-axis-0"].options.ticks.autoSkip = false;
chart.scales["x-axis-0"].options.ticks.stepSize = 1;
Note that it's not chart.scales["x-axis-0"].ticks as that contains the array of labels
 reupost
on 29 Mar 2018
reupost
on 29 Mar 2018
I've tried this, but it doesn't solve the problem for me. I get a second set of labels on the xaxis that contains all the labels, however they don't align with the data. The first level of labels with the skipping still exists:

 jnettik
on 29 Jun 2018
jnettik
on 29 Jun 2018
In case this issue wasn't solve yet. Keep that on mind that labels property is inside of data property
something like this.
 new Chart($("#element_id"), {
        type: 'line',
        data: {
            datasets: [
                {
                    label: 'A',
                    backgroundColor: "rgba(255, 99, 132, 0.5)",
                    borderColor: "rgb(255, 99, 132)",
                    fill: false,
                    data: [2.3, 1, 2.3, 4, 3.1],
                },
                {
                    label: 'B',
                    backgroundColor: "rgba(54, 162, 235, 0.5)",
                    borderColor: "rgb(54, 162, 235)",
                    fill: false,
                    data: [1.3, 1, 1.3, 3, 3.1]
                },
                {
                    label: 'C',
                    backgroundColor: "#95CB91",
                    borderColor: "#3C8C38",
                    fill: false,
                    data: [1,2, 4, 2.2, 1.8]
                }
            ],
            labels: ["L1", "L2", "L3", "L4", "L5"],
        },
 mgdagpin
on 9 Jan 2019
mgdagpin
on 9 Jan 2019
worked for me (https://github.com/jtblin/angular-chart.js/issues/423)
 ClaireToulouse
on 14 Mar 2019
ClaireToulouse
on 14 Mar 2019
Related issues
 JAIOMP
·
3Comments
JAIOMP
·
3Comments
 joebirkin
·
3Comments
joebirkin
·
3Comments
 akashrajkn
·
3Comments
akashrajkn
·
3Comments
 adriantombu
·
3Comments
adriantombu
·
3Comments
 nickgoodliff
·
3Comments
nickgoodliff
·
3Comments
Most helpful comment
I've found it in the documentation: