Cert-manager: Add an example grafana dashboard
Is your feature request related to a problem? Please describe.
Looking for an example grafana dashboard that could be include in this repo as a reference.
Describe the solution you'd like
A json file with grafana dashboard
Describe alternatives you've considered
N/A
Additional context
Given prometheus metrics were introduced in 0.6, just figured it could help
/kind feature
 timm088
All 12 comments
A basic one is shown in this post https://blog.jetstack.io/blog/cert-manager-0.6/
 PabloCastellano
on 14 May 2019
PabloCastellano
on 14 May 2019
^is that dashboard .json available anywhere on github?
I'm currently leveraging the nginx-ingress grafana chart, which shows all the Ingress Certificate Expiry results with a TTL on it. This might help?
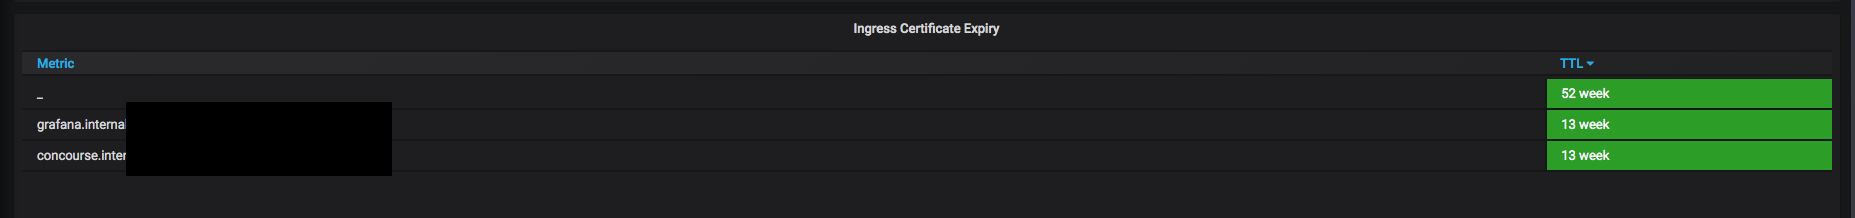
But it doesn't show other interesting about cert-manager itself like overall requests per 2m, /acme/new-order, etc. other things shown in the grafana screenshot in the blog post. Would be cool if that could be shared (assuming it's it's freely available)
 aegershman
on 27 Jun 2019
aegershman
on 27 Jun 2019
Found this post while looking for a cert-manager dashboard I can plug into my Grafana. I see the sample dashboard in the blog post but I don't see the dashboard json file. Anyone know where I can find it?
Thank you.
 tewing-riffyn
on 29 Aug 2019
tewing-riffyn
on 29 Aug 2019
Will be great if someone can share the work on a cert-manager dashboard.
 HaveFun83
on 16 Oct 2019
HaveFun83
on 16 Oct 2019
I threw this together the other day after running across the blog post. No idea if the graphs are accurate, but it's a start: https://grafana.com/grafana/dashboards/11001
 acobaugh
on 16 Oct 2019
acobaugh
on 16 Oct 2019
I threw this together the other day after running across the blog post. No idea if the graphs are accurate, but it's a start: https://grafana.com/grafana/dashboards/11001
Cool thanks a lot.
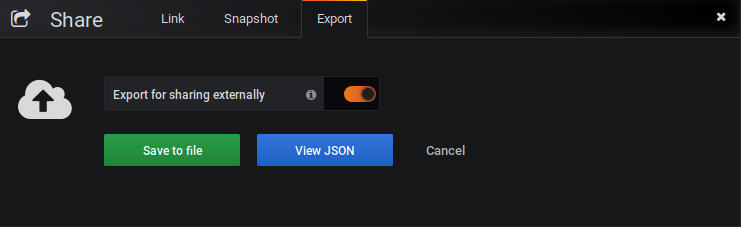
But can you share the dashboard externally as the datasource use some custom regex?
HaveFun83
on 16 Oct 2019
I threw this together the other day after running across the blog post. No idea if the graphs are accurate, but it's a start: https://grafana.com/grafana/dashboards/11001
Thanks for dashboard, it works except "label_values(..)" query:
label_values(certmanager_certificate_expiration_timestamp_seconds{exported_namespace=~".*"},name):

"invalid parameter 'query': parse error at char 13: unknown function with name \"label_values\""
 vukor
on 7 Nov 2019
vukor
on 7 Nov 2019
Issues go stale after 90d of inactivity.
Mark the issue as fresh with /remove-lifecycle stale.
Stale issues rot after an additional 30d of inactivity and eventually close.
If this issue is safe to close now please do so with /close.
Send feedback to jetstack.
/lifecycle stale
 retest-bot
on 5 Feb 2020
retest-bot
on 5 Feb 2020
Stale issues rot after 30d of inactivity.
Mark the issue as fresh with /remove-lifecycle rotten.
Rotten issues close after an additional 30d of inactivity.
If this issue is safe to close now please do so with /close.
Send feedback to jetstack.
/lifecycle rotten
/remove-lifecycle stale
retest-bot
on 6 Mar 2020
Rotten issues close after 30d of inactivity.
Reopen the issue with /reopen.
Mark the issue as fresh with /remove-lifecycle rotten.
Send feedback to jetstack.
/close
retest-bot
on 5 Apr 2020
@retest-bot: Closing this issue.
In response to this:
Rotten issues close after 30d of inactivity.
Reopen the issue with/reopen.
Mark the issue as fresh with/remove-lifecycle rotten.
Send feedback to jetstack.
/close
Instructions for interacting with me using PR comments are available here. If you have questions or suggestions related to my behavior, please file an issue against the kubernetes/test-infra repository.
 jetstack-bot
on 5 Apr 2020
jetstack-bot
on 5 Apr 2020
@munnerz do you mind sharing the dashboard json shown in the https://blog.jetstack.io/blog/cert-manager-0.6/ ?
Maybe we can even include it into the chart using the https://github.com/grafana/helm-charts/tree/main/charts/grafana#sidecar-for-dashboards. Something like the one here: https://github.com/helm/charts/blob/0c093133575d640710959d3442d5bad59c776942/stable/sealed-secrets/templates/configmap-dashboards.yaml
 bergerx
on 25 Nov 2020
bergerx
on 25 Nov 2020
Related issues
 kragniz
·
4Comments
kragniz
·
4Comments
 munjal-patel
·
3Comments
munjal-patel
·
3Comments
 f-f
·
4Comments
f-f
·
4Comments
 apetheriotis
·
3Comments
apetheriotis
·
3Comments
 jonathan-kosgei
·
4Comments
jonathan-kosgei
·
4Comments
Most helpful comment
Found this post while looking for a cert-manager dashboard I can plug into my Grafana. I see the sample dashboard in the blog post but I don't see the dashboard json file. Anyone know where I can find it?
Thank you.