I just run this command
python src/demo.py ctdet --arch resdcn_18 --demo images/ --load_model ctdet_coco_resdcn18.pth
but the inference time of net forward costs 0.095s in my V100 GPU, it's about 10FPS. any help?

 CPFLAME
All 11 comments
On my 1070 card, I got about 26 fps.
python test.py ctdet --load_model ./models/ctdet_coco_resdcn18.pth --keep_res
[2630/5000]|Tot:0:01:46|ETA:0:01:32|tot 0.037s(0.038s)|load 0.000s(0.000s)|pre 0.001s(0.001s)|net 0.033s(0.034s)|dec 0.001s(0.001s)|post 0.002s(0.002s)|merge 0.000s(0.000s)
 wangg12
on 21 Aug 2019
wangg12
on 21 Aug 2019
We also observed a slow down on Titan V. It seems related to .cuda(non_blocking=True) or pin_memory=True. Check this.
 xingyizhou
on 21 Aug 2019
xingyizhou
on 21 Aug 2019
@wangg12 @xingyizhou Thanks for your reply, but where should I modify the .cuda(non_blocking=True)? The pin_memory=True seems related to dataloader(which affects pre_process time), but my net forward time is very slow.
CPFLAME
on 22 Aug 2019
@wangg12 @xingyizhou Hi~ I think maybe I know the reason:
When I run python src/demo.py ctdet --arch hourglass --demo images/ --load_model ctdet_coco_hg.pth
the net forward cost 70 ms,which is similar to your report.
but when I use resnet18 and resnet101. resnet18 cost 95ms and resnet101 cost 96~97ms,while DLA34 cost 246ms.
Hourglass without DCN is faster than other methods. Maybe the DCN cost too much time?
CPFLAME
on 22 Aug 2019
What is your pin_memory? And what is your pytorch, cuda, driver version? Are you solely running this test without any other computation-expensive programs?
wangg12
on 22 Aug 2019
@wangg12
- The
pin_memoryis in src/test.py, but I ran the src/demo.py. By the way, what I care about is net forward time, I don't thinkpin_memorymakes a difference in net forward time, It is for speeding up pre-process time. - pytorch 0.4.1 , cuda 9.0 , nvidia driver 410.79 , CPU E5-2650 v4, GPU v100
- I shut down all other program for running this code. I'm pretty sure that I run this code without any other computation-expensive programs.
- Strangely,after I command
torch.cuda.synchronize()in src/lib/detectors/ctdet.py and src/lib/detectors/base_detector.py, which is for synchronizing GPU-CPU time. The net forward time of resnet18, resnet101 and dla34 are 7ms,23ms, 20ms. it's very similar to the report result. Is it a
coincidence? - I can just Reproduce the result of hourglass(net forward 70ms) with
torch.cuda.synchronize()on. When I command 'torch.cuda.synchronize()', hourglass run 35ms for net forward. It's strange. - I don't know why I can reach the report result with different synchronize setting(hourglass with synchronize and [resnet18,resnet101,dla34] without synchronize), any help for me?
- Any other setting question?
CPFLAME
on 23 Aug 2019
With demo.py, nothing changed, I got the following result with resnet_dcn18.
(pytorch version 1.2, cuda-10, driver 430, GPU 1070)
tot 0.060s |load 0.027s |pre 0.020s |net 0.009s |dec 0.001s |post 0.003s |merge 0.000s |
tot 0.083s |load 0.047s |pre 0.022s |net 0.009s |dec 0.001s |post 0.003s |merge 0.000s |
tot 0.074s |load 0.038s |pre 0.023s |net 0.009s |dec 0.001s |post 0.003s |merge 0.000s |
tot 0.066s |load 0.033s |pre 0.019s |net 0.009s |dec 0.001s |post 0.003s |merge 0.000s |
@wangg12
Thx !
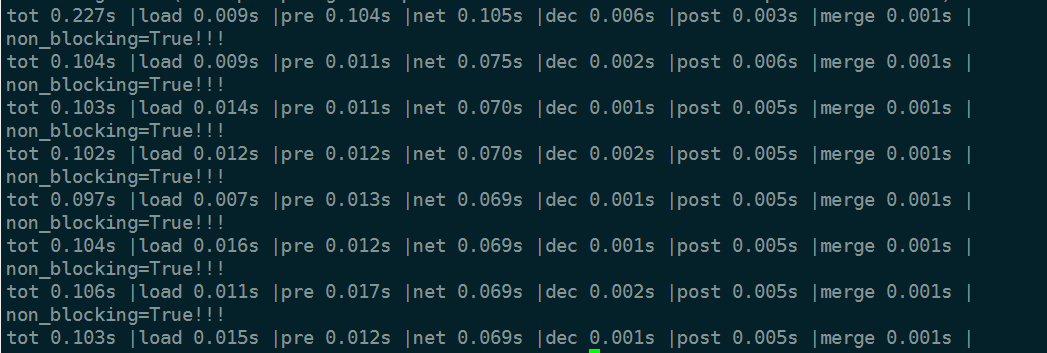
I just use pytorch 1.2, cuda-10 , driver 410 , GPU V100
And I use https://github.com/CharlesShang/DCNv2.git
with demo.py , I got this result.
It's wierd that pytorch, cuda vision and DCNv2 make such a big difference.
CPFLAME
on 23 Aug 2019
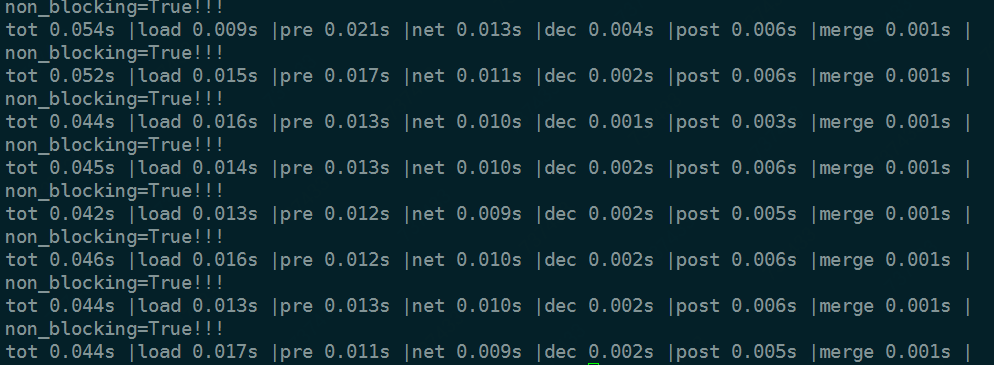
My DCNv2 is comed from https://github.com/open-mmlab/mmdetection/tree/master/mmdet/ops/dcn, FYI.
wangg12
on 23 Aug 2019
@wangg12 @CPFLAME Thamk you for all of your advice! You may not believe that I reduced the detection time cost from 0.18 seconds to 0.014 seconds on GTX1660S GPU!
 JOSHUAWENJZ
on 19 Nov 2020
JOSHUAWENJZ
on 19 Nov 2020
Hi,could you tell me how to get the fps?
 kirkzZ
on 31 Mar 2021
kirkzZ
on 31 Mar 2021
Related issues
 leiyaohui
·
3Comments
leiyaohui
·
3Comments
 HamsterHuey
·
4Comments
HamsterHuey
·
4Comments
 Alexyitx
·
6Comments
Alexyitx
·
6Comments
 zjp99
·
4Comments
zjp99
·
4Comments
 merckxiaan
·
7Comments
merckxiaan
·
7Comments
Most helpful comment
@wangg12

Thx !
I just use pytorch 1.2, cuda-10 , driver 410 , GPU V100
And I use https://github.com/CharlesShang/DCNv2.git
with demo.py , I got this result.
It's wierd that pytorch, cuda vision and DCNv2 make such a big difference.