cartopy+set_extent increasing y limits
Sorry if it is a wrong place to put this. New to github
Using cartopy = 0.15.1 and matplotlib = 2.0.2.
Plotting with ax.set_extent increases the y limits about -2(degree) at bottom and 4(degree) at top
import matplotlib.pyplot as plt
import cartopy.crs as ccrs
import cartopy.feature as cfeature
plt.figure(figsize=(10,8))
ax = plt.axes(projection=ccrs.PlateCarree())
ax.add_feature(cfeature.LAND)
ax.add_feature(cfeature.OCEAN)
ax.set_extent([36,105,-12,30])
ax.gridlines(crs=ccrs.PlateCarree(), draw_labels=True)
plt.show()

However ax.set_xlim and ax.set_ylim is working fine
ax.set_xlim(36,105)
ax.set_ylim(-12,30)
ax.gridlines(crs=ccrs.PlateCarree(), draw_labels=True)
plt.show()
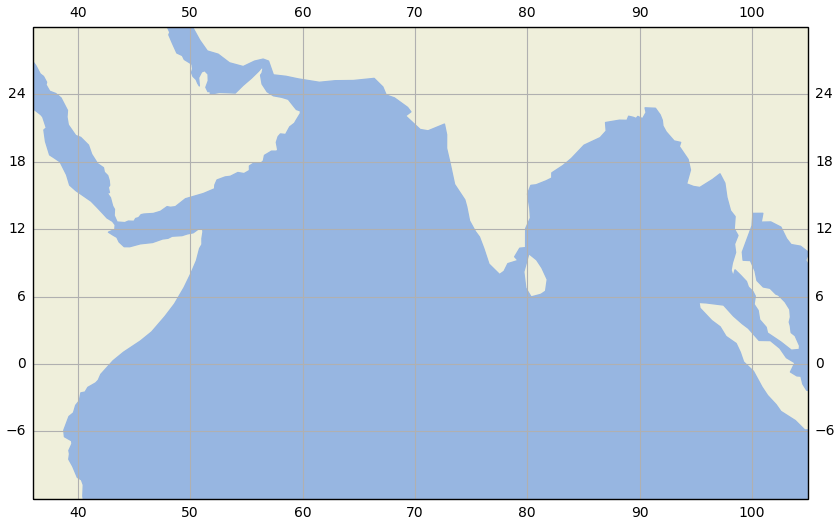
Is there a problem with ax.set_extent in the above mentioned versions of matplotlib and cartopy ?
 jithuraju1290
All 2 comments
You should add the crs keyword to set_extent:
ax.set_extent([36,105,-12,30], crs=ccrs.PlateCarree())
Hopefully this will solve your problem.
Our default choice for the coordinate reference system is not intuitive, and therefore it is always best to be explicit. We've updated all the examples to do this for the next version, and have plans to change the default too.
 ajdawson
on 13 Dec 2017
ajdawson
on 13 Dec 2017
Hi @jithuraju1290, stackoverflow is a good place to ask these types of questions.
https://stackoverflow.com/questions/tagged/cartopy
@ajdawson answered the same Q here for me a while ago
https://stackoverflow.com/questions/43470238/cartopy-set-extent-extending-requested-boundary
 raybellwaves
on 13 Dec 2017
raybellwaves
on 13 Dec 2017
Related issues
 lvphj
·
8Comments
lvphj
·
8Comments
 rutgerhofste
·
3Comments
rutgerhofste
·
3Comments
 choldgraf
·
3Comments
choldgraf
·
3Comments
 leecronce
·
8Comments
leecronce
·
8Comments
 pelson
·
4Comments
pelson
·
4Comments
Most helpful comment
You should add the
crskeyword toset_extent:Hopefully this will solve your problem.
Our default choice for the coordinate reference system is not intuitive, and therefore it is always best to be explicit. We've updated all the examples to do this for the next version, and have plans to change the default too.