Cartopy: Errors in coastline filling in Lambert Conformal conic projection
I noticed that coastlines are not filled correctly when I use Lambert conic projection. For example,
import cartopy
import cartopy.crs as ccrs
import matplotlib.pyplot as plt

fig = plt.figure()

ax = fig.add_subplot(111, projection=ccrs.LambertConformal())
feature = cartopy.feature.NaturalEarthFeature(name='coastline', category='physical',
                                              scale='110m',
                                              edgecolor='#000000', facecolor='#AAAAAA')
ax.add_feature(feature)
plt.show()
results in

It happens at all coastline scales and with different extents of the map, so I guess it's a bug. Maybe it's related to #579
 dennissergeev
All 13 comments
I'm getting the same problem with the oceans on master right now:
proj = cartopy.crs.LambertConformal(central_latitude=25, central_longitude=-97,
                                    standard_parallels=[25])
ax = plt.axes(projection=proj)
ax.add_feature(cartopy.feature.OCEAN)
ax.coastlines()
ax.set_extent([-140, -70, 20, 60])

Does not occur if we use PlateCaree() instead:

 dopplershift
on 12 Jan 2017
dopplershift
on 12 Jan 2017
Also works fine if we use standard_parallels=[35] for the Lambert projection.
dopplershift
on 12 Jan 2017
May I add LambertAzimuthalEqualArea to the list or reproducers with current master + matplotlib2
proj = cartopy.crs.LambertAzimuthalEqualArea(central_latitude=45,
                                             central_longitude=-100)
ax = plt.axes(projection=proj)
ax.add_feature(cartopy.feature.OCEAN)
ax.coastlines()
ax.set_extent([-140, -70, 20, 60])

 akrherz
on 3 Oct 2017
akrherz
on 3 Oct 2017
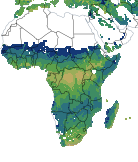
I have just encountered a similar issue, with the same script on 2 different machines, but between using Python 3.6 (error) and Python 2.7: both with Cartopy 0.15.1
ax.add_feature(cfeature.BORDERS, linewidth=0.3, color='#778899')
NB however it may due to some package differences:
For example:
matplotlib = 1.5.3 on P2.7
matplotlib = 2.1.0 on P3.6
Python 2.7
Python 3.6
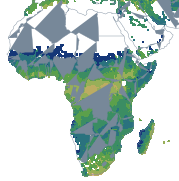
I have limited use rights so I'm afraid its not easy for me to go installing/switching packages etc to test further
 byersiiasa
on 4 Dec 2017
byersiiasa
on 4 Dec 2017
A user posted a question on Stack Overflow with the same issue of adding oceans to LambertConformal:
https://stackoverflow.com/questions/48503737/cartopy-oceans-cover-land
User demonstrated that it was a problem with the projection, not the features they were adding.
 kaedonkers
on 30 Jan 2018
kaedonkers
on 30 Jan 2018
@kaedonkers @dopplershift
In my case i wasn't using Lambert. Either Robinson or PlateCarree. So either it is a different issue, or something that extends beyond just the Lambert projections.
byersiiasa
on 5 Feb 2018
I have just tested the following code:
import cartopy.feature as cfeature
import cartopy.crs as ccrs
import matplotlib.pyplot as plt
fig = plt.figure()
ax = plt.axes(projection= ccrs.PlateCarree())
ax.set_global()
ax.coastlines( linewidth=0.3, color='#778899')
ax.add_feature(cfeature.BORDERS, linewidth=0.3, color='#778899')
Python 3.6 (Anaconda) (2 different machines)
Matplotlib 2.1.2, Cartopy 0.15.1
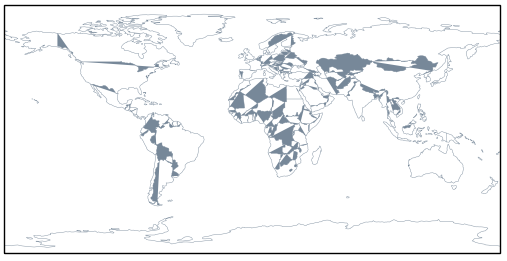
Python 2.7 (Anaconda)
Matplotlib 2.1.2 (and Matplotlib 1.5.3); Cartopy 0.15.1

byersiiasa
on 19 Feb 2018
@byersiiasa your difference between 2 and 3 is likely because of keyword argument & dictionary ordering. If you pass a more explicit facecolor='#778899', then both 2 and 3 show weird looking patches. If you pass edgecolor='#778899', then both 2 and 3 look fine. I assume you'd like the latter. I'm not so sure this is really related to this issue as I don't think the BORDERS feature is intended to be filled.
Edit: that inconsistency is fixed by #1029.
 QuLogic
on 21 Feb 2018
QuLogic
on 21 Feb 2018
Thank you @QuLogic ! That was exactly the issue! Perfect timing.
byersiiasa
on 21 Feb 2018
So I've spent a while looking into this and the 'bug' is that coastlines are _not_ intended to be filled. They appear to be a bunch of line strings only with no polygonal topology. I tried several methods to turn them into polygons, but they are simply not designed for it. If you just convert blindly, several line strings are not long enough, and others are only half a continent (Asia is split in a North and South-ish half).
The best way to achieve OP's desired result is to add coastlines with no fill and land with fill:
import cartopy.feature as cfeature
import cartopy.crs as ccrs
import matplotlib.pyplot as plt

fig = plt.figure()
ax = fig.add_subplot(111, projection=ccrs.LambertConformal())

feature = cfeature.NaturalEarthFeature(
    name='coastline', category='physical',
    scale='110m',
    edgecolor='#000000', facecolor='none')
ax.add_feature(feature)

feature = cfeature.NaturalEarthFeature(
    name='land', category='physical',
    scale='110m',
    facecolor='#AAAAAA')
ax.add_feature(feature)

plt.show()
or using builtin features:
import cartopy.feature as cfeature
import cartopy.crs as ccrs
import matplotlib.pyplot as plt

fig = plt.figure()
ax = fig.add_subplot(111, projection=ccrs.LambertConformal())

ax.add_feature(cfeature.COASTLINES, edgecolor='#000000')
ax.add_feature(cfeature.LAND, facecolor='#AAAAAA')

plt.show()
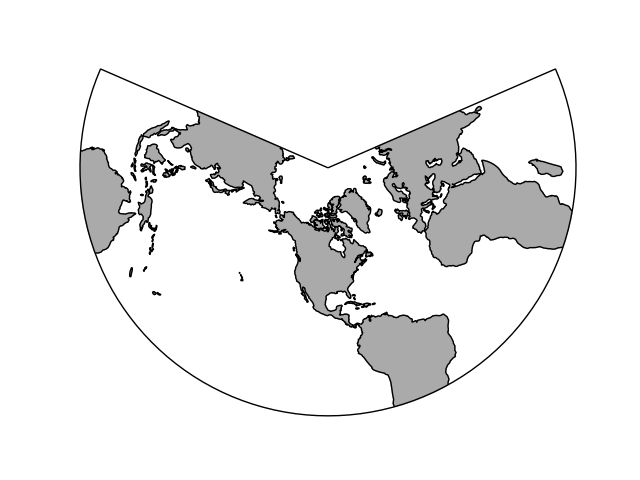
I'm tempted to close this "won't fix", or rather "can't fix", because this is simply the way the Natural Earth dataset is defined and there's not much we can do to clean it up automatically. If you want to pursue cleaning that up, that would be best done with them https://github.com/nvkelso/natural-earth-vector/
QuLogic
on 16 Oct 2018
As for the bug in the first comment, https://github.com/SciTools/cartopy/issues/803#issuecomment-272286945, and third comment, https://github.com/SciTools/cartopy/issues/803#issuecomment-333909742, the OCEANS _are_ true polygons. The first case is a symptom of the same problem as #1131 and is fixed by #1146. I'm not sure about the second one just yet, but I'm going to open it as a separate issue.
Since the original report is not technically a bug (as above), I'm going to close this issue.
QuLogic
on 16 Oct 2018
Oh, also the Stack Overflow post is the same as #1131 as well, and is fixed by #1146.
QuLogic
on 16 Oct 2018
Thanks, @QuLogic!
dennissergeev
on 16 Oct 2018
Related issues
 munro
·
8Comments
munro
·
8Comments
 leecronce
·
8Comments
leecronce
·
8Comments
 pelson
·
4Comments
QuLogic
·
7Comments
pelson
·
4Comments
QuLogic
·
7Comments
 mjarrett
·
5Comments
mjarrett
·
5Comments
Most helpful comment
@byersiiasa your difference between 2 and 3 is likely because of keyword argument & dictionary ordering. If you pass a more explicit
facecolor='#778899', then both 2 and 3 show weird looking patches. If you passedgecolor='#778899', then both 2 and 3 look fine. I assume you'd like the latter. I'm not so sure this is really related to this issue as I don't think theBORDERSfeature is intended to be filled.Edit: that inconsistency is fixed by #1029.