Cardano-node: [BUG] - Epoch Boundary High ram / cpu stuck
Exernal
Summary
Relays after epoch transition CPU's show heavy load and ram climbs from low amount prior to transition to 3GB or greater usage and sticks until node reset. This has been reported to crash nodes on epoch transition,
This crashes minimum suggested spec nodes with dual cpu and 4gb ram not running large swap files, nodes with more resources continue to function but the ram usage sticks to several GB (3-4) in most cases until the node is restarted. The core did also increase in ram usage.
Steps to reproduce
Steps to reproduce the behavior:
restart node before epoch transition and observe
System info (please complete the following information):
- OS: Ubuntu
- Version 20.04 /18.04
- 1.18.0 ba0f96b
default logging is disabled so i do not have logs however this has happened on several nodes and should be repeatable.
 glitch40
All 10 comments
I am also seeing this heavy load issue with minimum spec nodes on 1.18.0 and Ubuntu 20.04. But not all of them. In addition, my experience is if the machine passes the epoch boundary resource use recovers to normal after without node restart.
This occurs only on my (identical) nodes that are showing 23-24 or greater connected peers (excess of 20 recommended peers as a result of what topologyUpdater.sh returns after the valency is factored for on cardano-node start)
One example had 26 peers and consumed 4GB of RAM and 2GB Swap within moments of the epoch boundary being hit at which point cardano-node was killed
Also have logging disabled at present so nothing further to share.
 monkolli
on 28 Jul 2020
monkolli
on 28 Jul 2020
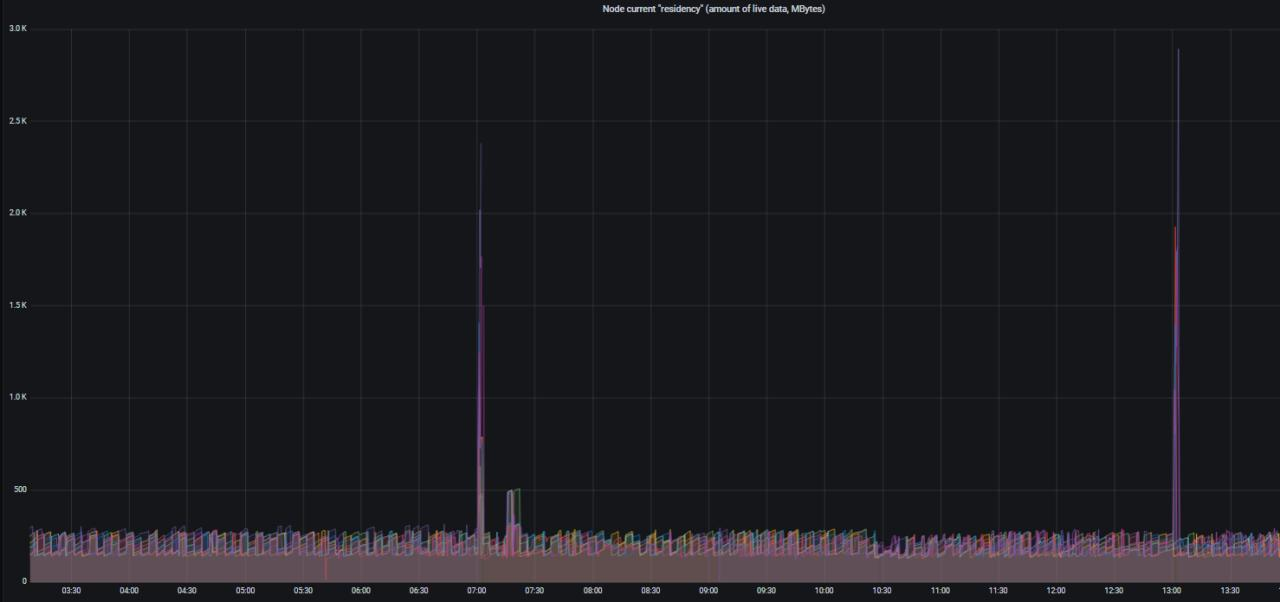
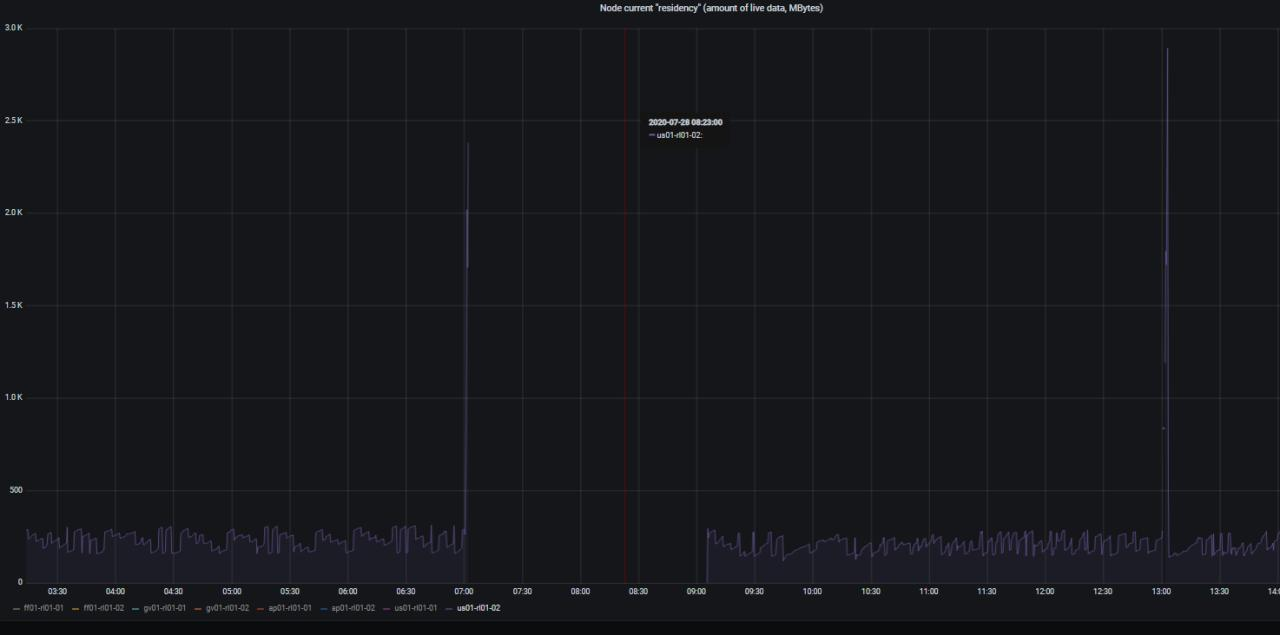
I confirm, all my 8 relays have a spike at the time of epoch change. Those ones on small vm sometimes crash with a "killed process" message.
 feqifei
on 28 Jul 2020
feqifei
on 28 Jul 2020
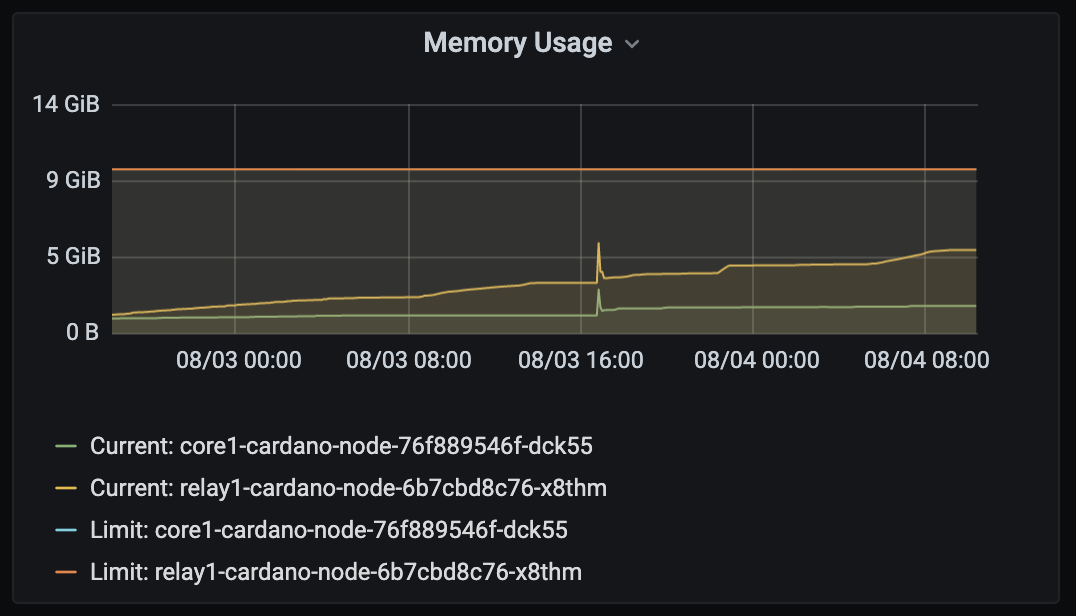
I am currently running cardano-node v1.18 on Docker/Kubernetes and have been for at least a day. I give each container a guaranteed 1vcpu and a requested 1GB of memory with a limit of 3GB. I do notice these spikes in usage but they have never crashed.
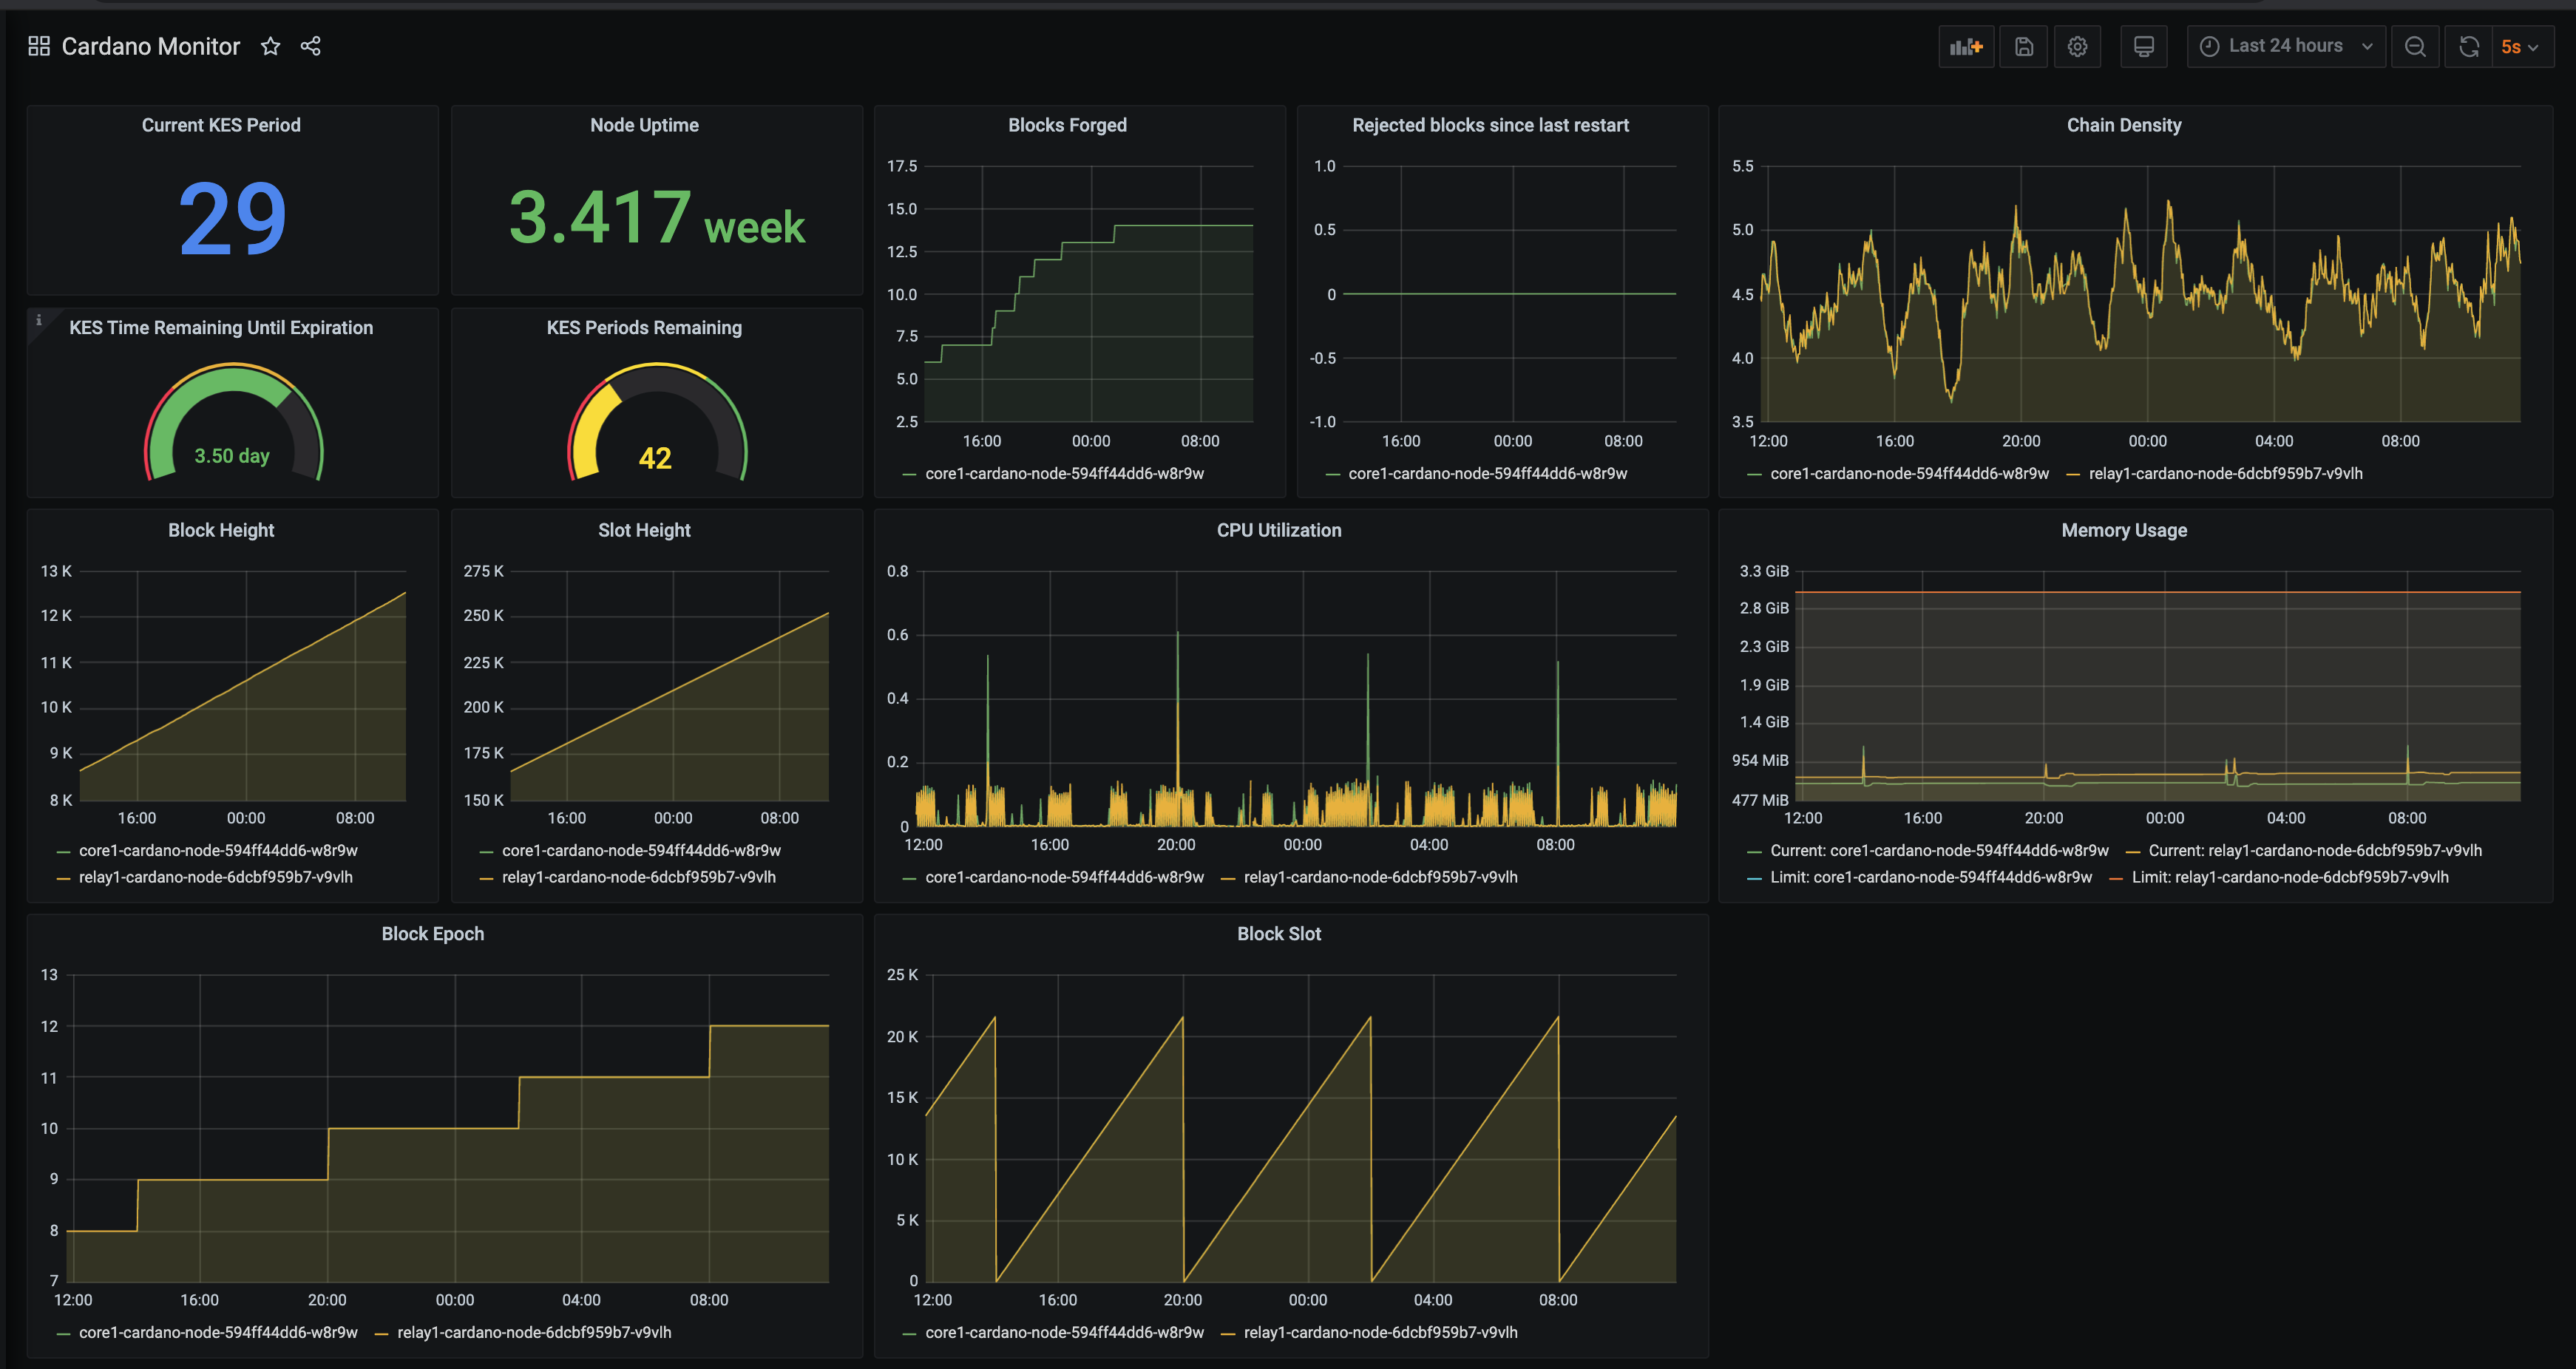
You can view the dashboard at https://grafana.fra.zenithpool.io/d/XlUdwmZGk/cardano-monitor?orgId=1&from=now-24h&to=now&refresh=5s
 zenithpool
on 28 Jul 2020
zenithpool
on 28 Jul 2020
I noticed that memory climbed on all nodes at epoch cutover from 208 -> 209. Both relays and BPs.
The fact that memory increase on epoch boundary is expected with the calculation that is needed but the questions are, is the extra allocated memory released again by GC. So far it does not seem to be.
Graph show RSS memory consumption and how it jumped up at epoch switch. Has stayed at the increased usage since then.

PS! Updated graph after giving it some more time. It does seem to release memory after a while.

 Scitz0
on 4 Aug 2020
Scitz0
on 4 Aug 2020
Its more noticeable on the "suggested" spec machines with 2c 4gb on 208 -> 209 Again the ram creeps up through epoch leading to the transition which will max the ram usage on the instance then ram will continue to be used and not released as Scitz0 displaed above. The smaller nodes (4gb ram) risk spikes at the calculation that crash the node from being OOM mine are still at 3.68GB usage hours after the transition which remains unless forced restart or crash on next epoch transition.
6h after this post the node crashed out of memory "cardano-node: internal error: Unable to commit 1048576 bytes of memory"
glitch40
on 4 Aug 2020
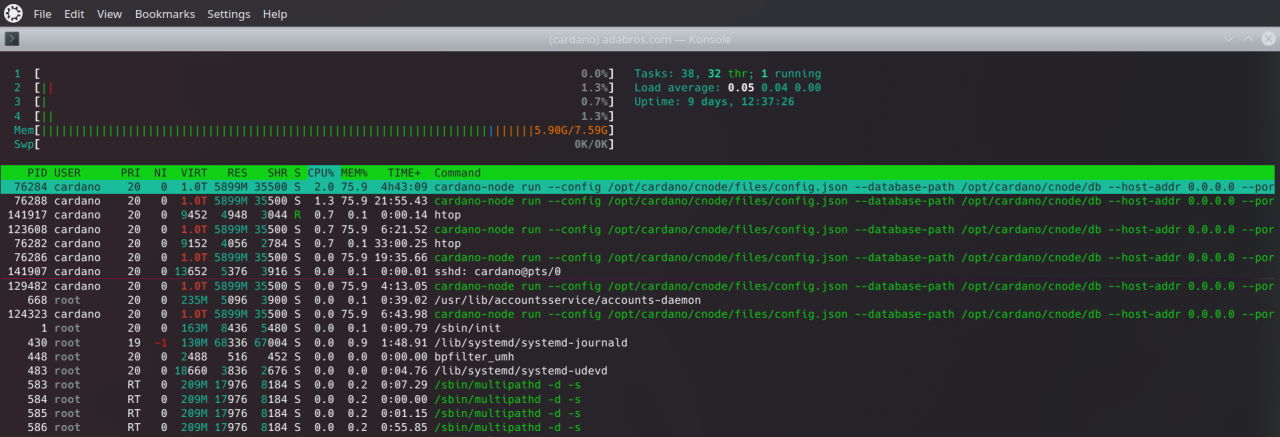
I am seeing memory usage in ~6gb for the whole box (when node isn't running, the box only uses ~150mb ram)
 latheesan-k
on 4 Aug 2020
latheesan-k
on 4 Aug 2020
I have been running multiple instances cardano-node 1.18.0 on docker with a memory limit of 10 GB. After the epoch transition, I noticed a huge spike in usage with the relay at 5GB of memory. Still monitoring... They did update the release notes and noted that for stake pools the suggested memory limit is 8GB
zenithpool
on 4 Aug 2020
TICKER : ADAGL, GLNET - ADA Globe Network
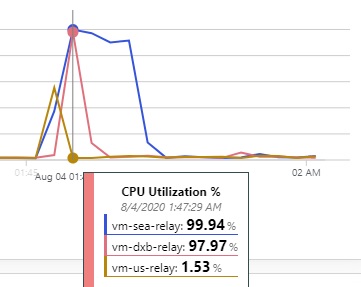
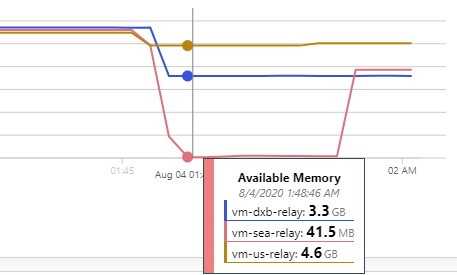
I have some observation to share If it could help. I have relays at US, Dubai and Singapore. I am assuming that snapshot trigger would have happened from some data center in US since the block chain is federated currently. (I could be wrong). Below is the observation.
CPU / Memory spike started in following order
- US
- Singapore
- Dubai
Though all nodes are not releasing memory currently (this could be a separate problem), I can see that US node stabilized fast followed by Dubai and then Singapore.
Just assumption from my side is below.
Latency order --> US --> Singapore ---> Dubai (low latency to high)
Snapshot start order --> US --> Singapore ---> Dubai
High peers order ---> US (400+ peers) --> Dubai (Most EU peers) --> Singapore (Less peers)
Snapshot completion order --> US --> Dubai ---> Singapore
Memory release issue:
High in Singapore
Medium in Dubai
Low in US
All my relay servers are having same specification running only Cardano node. Number of peers connected to all nodes are almost same for my servers. (around 18 - 20)
Attachments below. I am not sure memory issue has anything to do with relays density across globe but thought worth mentioning here...I could be wrong :)
 mestakepool
on 5 Aug 2020
mestakepool
on 5 Aug 2020
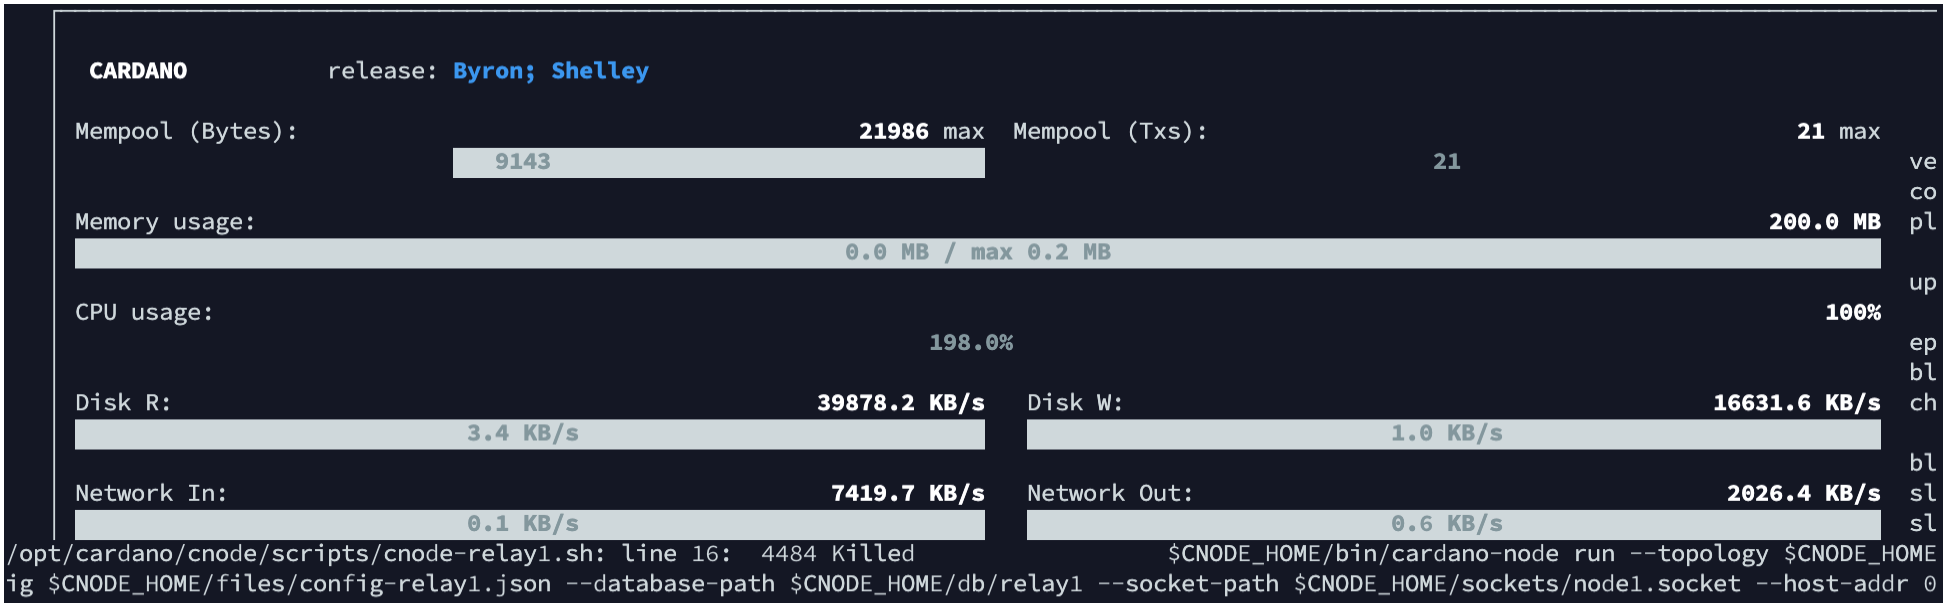
I also experienced the same issue during the 2 new Shelley Epoch's. Running 4GB of mem and 2 cpus. It killed itself both times.
 chadle-git
on 11 Aug 2020
chadle-git
on 11 Aug 2020
hi @glitch40 we've made some significant improvements, we`ll close this ticket. If you are still seeing the issue, please open a new ticket.
 vix-io
on 15 Sep 2020
vix-io
on 15 Sep 2020
Related issues
 psychomb
·
6Comments
psychomb
·
6Comments
 mark-stopka
·
6Comments
mark-stopka
·
6Comments
 peteremiljensen
·
4Comments
peteremiljensen
·
4Comments
 deepfire
·
4Comments
deepfire
·
3Comments
deepfire
·
4Comments
deepfire
·
3Comments
Most helpful comment
I confirm, all my 8 relays have a spike at the time of epoch change. Those ones on small vm sometimes crash with a "killed process" message.
